Welcome to Visual-baseball.com! I’ve just completed an update where data for the 2019 season is now part of the Batting Explorer 2010-2019 interactive visualization. This is a tool where we have every batter in a given season depicted via a baseball card type of framework, showing their key stats for the season, as well as the positions played in the field (by number of games), using a visual of a baseball diamond. It’s a highly interactive way to filter through multiple seasons worth of data by team, player, position, and more.
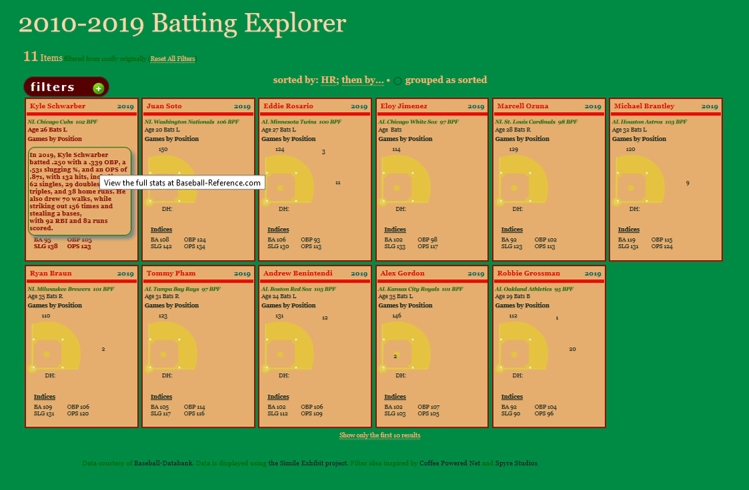
So while you’re waiting for on the field action to start, have a look at the Batting Explorer to answer some of the questions on your baseball mind. For example, here’s a quick look at all of the left fielders who played at least 110 games at the position in 2019 (by using the filters pill at the top left):

We can take the same results and sort it by the number of home runs, to see who the power hitters in the group were for 2019, by sorting from high to low:

Now we see Kyle Schwarber and Juan Soto at the top of the display. Let’s look at Schwarber’s details by simply hovering over his card:

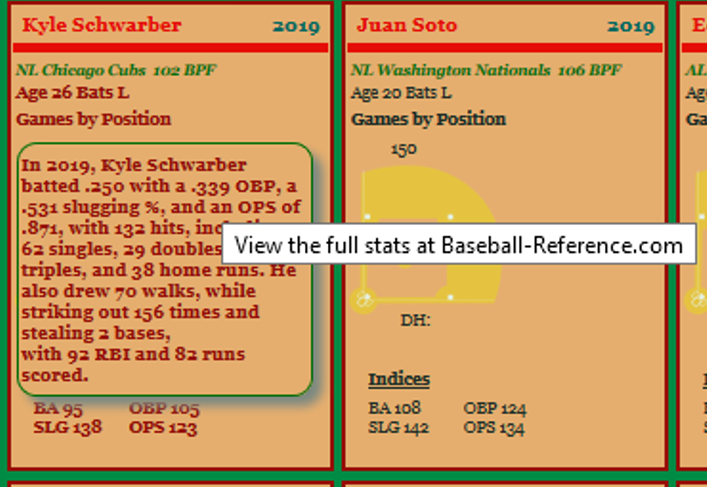
We now have a pop-up within Schwarber’s card telling a mini-story about his batting stats for the 2019 season. Here’s a closer look:

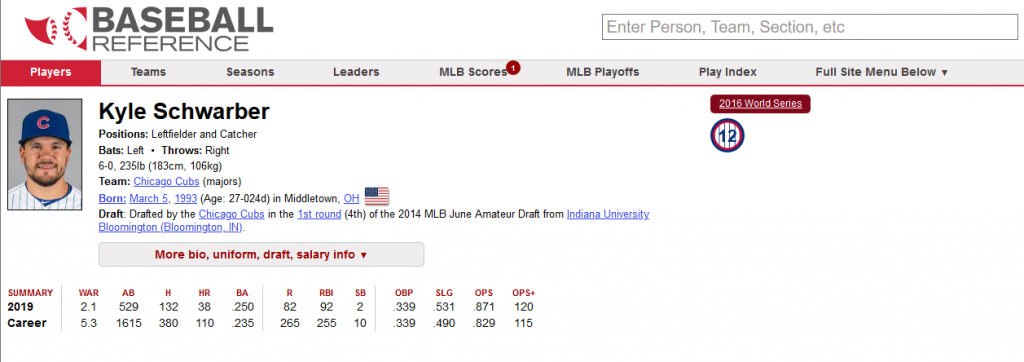
From this, we learn that Schwarber hit 38 home runs, batted .250, and had an OPS (on-Base + Slugging) of .871, as well as multiple other details. Additionally, you likely noticed the “View the full stats at Baseball-Reference.com” pop-up tag. To get there, simply click on Schwarber’s card, and you’ll be transported (in a new tab) to his page at Baseball-Reference:

Pretty cool, right? Give it a try, or pick your own filters, look at specific teams and seasons, and so on. Here’s the Batting Explorer page, with every decade back to 1900-1910 available for your curiosity.
More updates to come soon on the 2019 data, and thanks for reading!