Thanks to some unusually cold and rainy weather, I’ve been able to focus on updating both my source databases as well as some of the visualizations built from the data. That’s a roundabout way of saying that the baseball Game Summary exhibits have been updated for both the 2016 & 2017 seasons. They can be found in the portfolio section of the site by following this link.
As a refresher, the baseball game summaries give you a sort of visual box score for every game played in a season, featuring the line score for the game, winning and losing pitchers, attendance, and much more information pertaining to each specific game. The real power comes from the ability to filter results to find all games that match specific criteria.
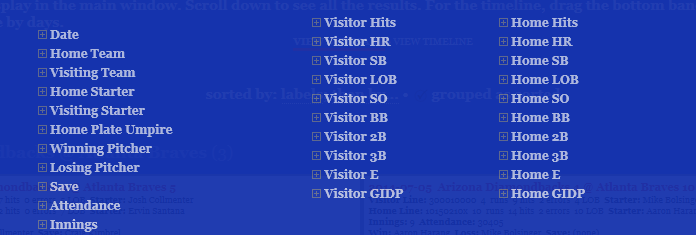
As you can see, there are many available filter options, right down to who the home plate umpire is for every game.
Here’s a quick illustration of how the filters can be used. We’ll filter 2017 results where Clayton Kershaw was the starting pitcher at home, and gave up 4 home runs (a very rare event!). First, we select Kershaw as the Home Starter, and then we open the Visitor HR filter, and select 4 (there’s just one instance). We can then apply these filters to see at which game this unusual event took place.
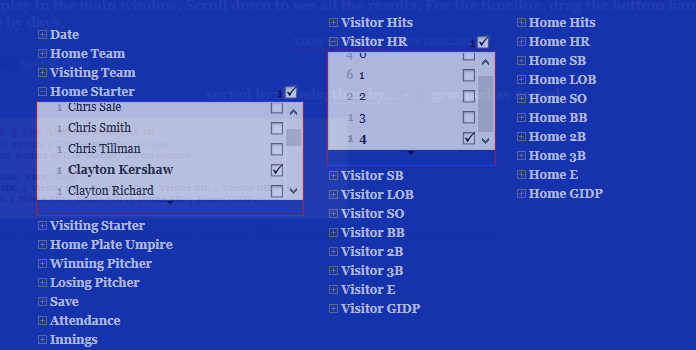
Closing the filter window, we see the single game box score returned by our filters:

Ironically, we can see that the Dodgers not only won this game, with Kershaw as the winning pitcher, but that they too hit 4 home runs (Home HR in the box score). We can also see that the Mets struck out 13 times (Visitor SO) and the Dodgers 12 times (Home SO). Must have been a wild day at Dodger Stadium on June 19th for the 43,266 in attendance!
As you can see, a lot of information can be gleaned using just a couple of selections to filter the data. There are nearly endless possibilities for using the filters to return the information that most interests you. So have a look at the game summaries and any other items in the portfolio section. Enjoy, and thanks for reading!
