In our previous post I shared the SQL code I created to pull data for our upcoming set of trade networks based on WAR (Wins Above Replacement) numbers from the Neil Paine 538 MLB data set. The prior post dealt with creating nodes for a network graph; this post will share code for edge creation. In simple terms, a graph needs edges that connect related nodes; for our case we need to connect transaction (trade) nodes to the teams and players involved in each transaction.
Part of what makes this case interesting is my desire to show edge weights based on the future WAR value each team received. Showing edges with varying weights will quickly help users to identify the relative importance of a trade. Wider edges will indicate a trade that involved high future value for one or both teams. In seeing the individual players involved in a common trade we can pinpoint where the future value (or lack thereof) comes from. This will become much clearer when the graphs are posted; I’ll do one or more posts on how to use and interpret each graph.
For now let’s examine the code. Gephi requires users to identify Sourcenodes and Targetnodes whether the edges are Undirected(i.e.- it doesn’t matter which node leads to the other) or Directed. Our initial code is for transactions to teams:
SELECT CONCAT(tr.TransactionID, ‘-‘, tr.PrimaryDate) AS Source, t.franchID AS Target, CONCAT(‘The ‘, t.name, ‘ received ‘, ROUND(SUM(h.WAR162),1),
‘ wins in future WAR value’) AS Label,
IF(ROUND(SUM(h.WAR162),1) = tr.season and tr.Type = ‘T’ AND tr.Season >= 1901 and LENGTH(tr.TeamTo) = 3 AND LENGTH(tr.TeamFrom) = 3
AND tr.Season = t.yearID
GROUP BY tr.TransactionID, tr.PrimaryDate, t.franchID, t.name;
With this code we are linking every transaction to the teams receiving one or more players in a trade. Note that we are summing the WAR value to create an edge weight based on the total value received by each team. If four players were involved (two to each team) these edge weights will reflect the combined values of these players. Note that we are setting edge weight = 1.0 if the future WAR is less than 1 (some will actually be negative so we need a minimal edge to show). Here’s a sample of results:
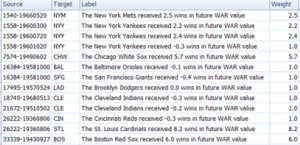
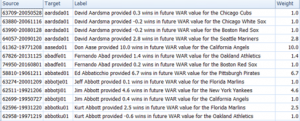
In contrast, the edges linking a transaction to individual players are based solely on that one player’s value. In the case cited above we will wind up with four lines of varying weights. Otherwise the code is quite similar:
SELECT CONCAT(tr.TransactionID, ‘-‘, tr.PrimaryDate) AS Source, p.playerID AS Target, CONCAT(p.nameFirst,’ ‘, p.nameLast, ‘ provided ‘, ROUND(SUM(h.WAR162),1),
‘ wins in future WAR value for the ‘, t.name) AS Label,
IF(ROUND(SUM(h.WAR162),1) = tr.season and tr.Type = ‘T’ AND tr.Season >= 1901 and LENGTH(tr.TeamTo) = 3 AND LENGTH(tr.TeamFrom) = 3
AND tr.Season = t.yearID AND t.franchID = h.franch_ID
GROUP BY tr.TransactionID, tr.PrimaryDate, p.nameFirst, p.nameLast, p.playerID, t.name;
The same logic on edge weights applies but now at the player level. Here are a few results:
I hope this makes sense – it will all become much more clear when the network graphs are produced. The good news is that I already have three graphs created and many more to come shortly. I’ll have some of them available on the site later this week. As always, thanks for reading.
