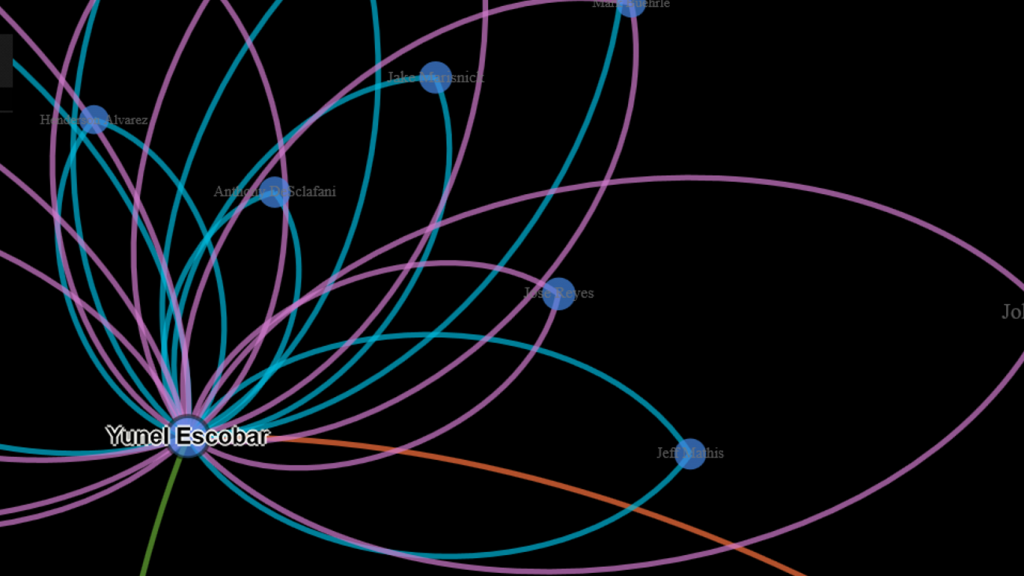
Over the last 10 days I’ve been playing around with code that will enable some new versions of the MLB trade networks I premiered way back in 2015. The goal this time around is to factor in the future value of a trade to each of the participating teams. There are multiple measures that could be used for this assessment but I’m going with the WAR162 value from Neil Paine’s 538 github data source. Here’s how the site describes the War162 measure: JEFFBAGWELL WAR per 162 team games. Now you may ask why Jeff Bagwell? While he was a talented hitter for many years, his name is used as an acronym for this:
“The file “jeffbagwell_war_historical.csv” contains wins above replacement (WAR) data — according to JEFFBAGWELL (the Joint Estimate Featuring FanGraphs and B-R Aggregated to Generate WAR, Equally Leveling Lists), which averages together WAR from Baseball-Reference.com and FanGraphs — plus various other metrics for MLB since 1901.” Fun stuff, right?
The bottom line from my perspective is that this measure provides a robust way of assessing the value of a trade based on performance after the trade date. Did one team benefit while another team received a player who added no future value? Or did both teams make out equally well? Or was the trade of minimal value for both sides? These are the questions I’m attempting to visually address using network analysis and visualization.
Now comes the technical aspect for all you database and code lovers. First step is to create the network nodes; in this case we need to display the individual trade transactions, teams, and players. Let’s look first at the transactions using the Visual-Baseball MySQL source data:
SELECT CONCAT(a.Id, ‘-‘, a.PrimaryDate) as Id, CONCAT(‘Transaction ‘,a.Id,’ is from the ‘, a.Season, ‘ season’) AS Label,
‘Trade’ AS Type, SUM(a.Size) AS Size
FROM
(SELECT tr.TransactionID AS Id, tr.Season, tr.PrimaryDate, ROUND(SUM(h.WAR162),1) as Size
FROM historical_WAR_and_more h
INNER JOIN People p
ON h.key_bbref = p.bbrefID
INNER JOIN trades2021 tr
ON p.retroID = tr.Player
INNER JOIN Teams t
ON tr.TeamTo = t.teamID
WHERE tr.Season >= 1901 and h.year_ID >= tr.season and tr.Type = ‘T’ and tr.TeamTo = t.teamID and LENGTH(tr.TeamFrom) = 3
AND tr.Season = t.yearID and t.franchID = h.franch_ID
GROUP BY tr.TransactionID, tr.season, tr.TeamFrom, tr.TeamTo, tr.PrimaryDate) a
GROUP BY a.Id, a.PrimaryDate, a.Season;
Here we are simply creating a node for each trade transaction, a label showing the teams involved and the trade date, and summing up the previously mentioned WAR162 to size the nodes. This will be an important part of the graph – trades that created large future values (for one or both teams) will be more prominent in the graph. Small value trades will be represented by very small nodes indicating their relative lack of importance. This one was a challenge, but finally got the code to deliver the expected results.
The next step is to create team nodes; in this case we’ll provide a constant size:
SELECT t.franchID AS Id, tf.franchName AS Label, 15 AS Size
FROM historical_WAR_and_more h
INNER JOIN People p
ON h.key_bbref = p.bbrefID
INNER JOIN trades2021 tr
ON p.retroID = tr.Player
INNER JOIN Teams t
ON tr.TeamFrom = t.teamID
INNER JOIN TeamsFranchises tf
ON t.franchID = tf.franchID
WHERE tr.season >= 1901 and h.year_ID >= tr.season and tr.Type = ‘T’ and h.team_ID = tr.TeamTo and LENGTH(tr.TeamFrom) = 3
GROUP BY t.franchID, tf.franchName;
By applying a constant node size of 15, each team will have a similar appearance in the graph which will not distract us from the trade values (some will be much larger than 15).
Our third and final node step is to provide information on all players involved in one or more trades:
SELECT Id, Label, ‘Player’ AS Type, 5 AS Size
FROM
(SELECT p.playerID AS Id,
CONCAT(h.player_name, ‘ (‘, p.birthYear,’-‘,p.deathYear,’)’,’ played from ‘,LEFT(p.debut,4),’ to ‘,LEFT(p.finalGame,4)) AS Label
FROM historical_WAR_and_more h
INNER JOIN People p
ON h.key_bbref = p.bbrefID
INNER JOIN trades2021 tr
ON p.retroID = tr.Player
WHERE tr.season >= 1901 and h.year_ID >= tr.season and tr.Type = ‘T’ and LENGTH(tr.TeamFrom) = 3
and LENGTH(tr.TeamTo) = 3
AND p.deathYear > 1900
GROUP BY h.player_name, p.playerID, p.birthYear, p.deathYear, p.debut, p.finalGame
UNION ALL
SELECT p.playerID AS Id,
CONCAT(h.player_name, ‘ (‘, p.birthYear,’-‘,’ )’,’ played from ‘,LEFT(p.debut,4),’ to ‘,LEFT(p.finalGame,4)) AS Label
FROM historical_WAR_and_more h
INNER JOIN People p
ON h.key_bbref = p.bbrefID
INNER JOIN trades2021 tr
ON p.retroID = tr.Player
WHERE tr.season >= 1901 and h.year_ID >= tr.season and tr.Type = ‘T’ and LENGTH(tr.TeamFrom) = 3
and LENGTH(tr.TeamTo) = 3
AND ISNULL(p.deathYear)
GROUP BY h.player_name, p.playerID, p.birthYear, p.deathYear, p.debut, p.finalGame) a
GROUP BY Id, Label;
Here we are running a UNION query so we can gather information about the players moving in each direction of a trade (from one team to another). We then combine that information and apply a fixed size of 5 since there are far more players than teams. We’ll have the ability in the finished networks to zoom in and see more about each player.
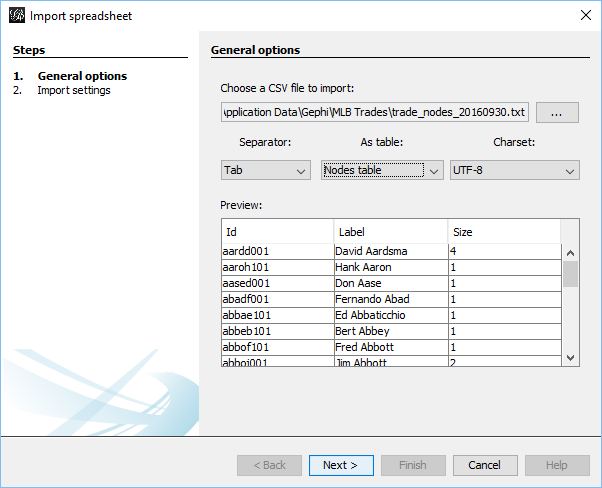
Each of these 3 outputs (trades, teams, and players) is combined into a single input file that will feed Gephi. We should wind up with between 10k and 20k nodes which we’ll be able to filter
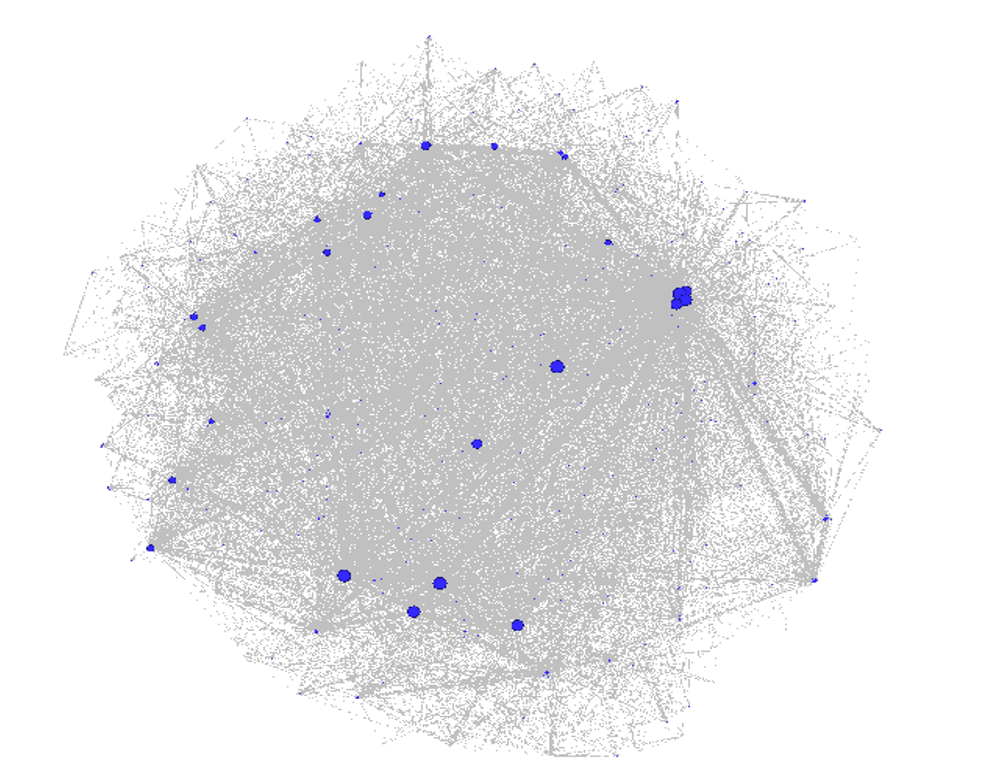
and zoom on in the network graph. I have high hopes for this set of networks (there may be one for each team as well as a comprehensive one) as it should really help display the most important trades in MLB history.
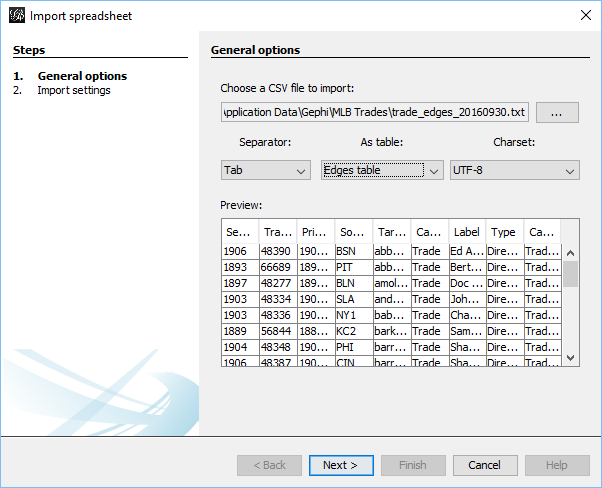
That’s it for our node creation process; the next post will share how we create the edges that will connect trades to teams and teams to players. Thanks for reading!
