Tag: WAR

My New Book – The Work Begins

I’ve had a baseball visualization book in my head for the better part of a decade but kept setting it aside. Finally, things have come together, and the work has begun. My working title is “Career Arcs: A Visual Analysis of MLB Player Performance”, as the focus will be on the value players have achieved across their playing career.

The initial stage, as is so often the case, is centered on data wrangling, the art of procuring, loading, creating (formulas), analyzing, and finally, visualizing the base data. My process starts with the source data, available under the MIT license, which gives me the ability to use the data however I choose. I will always acknowledge Neil Paine for his great dataset focused on multiple interpretations of WAR (Wins Above Replacement), a widely used metric for baseball statheads. Without this data, creating the book would prove far more challenging.

Exploratoryis one again my primary data wrangling tool; it makes the powerful capabilities of R accessible to a non-coder like myself. In Exploratory, I can load the data, create filters and formulas, and do some pretty cool visualizations. My use is twofold (at least); I can analyze the data on the back end while simultaneously building charts and dashboards for potential use within the book. Here’s an example dashboard I’ve created (in process) where I can see career WAR numbers for any MLB player through the 2024 season:
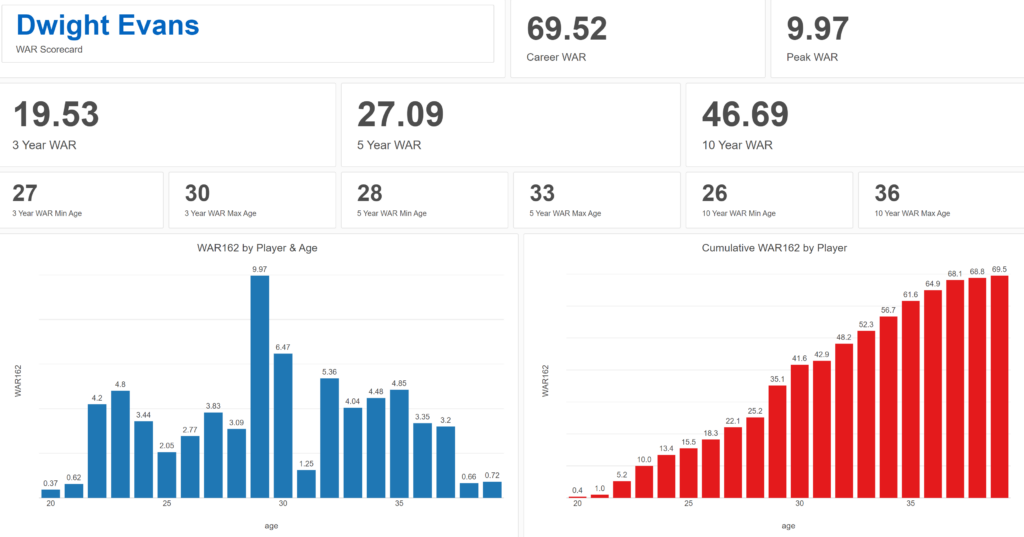
Dwight Evans WAR Scorecard

These dashboards allow for data discovery on my end while painting a nice visual picture that may wind up in an appendix section of the book. I love creating charts and dashboards that can be used for more than one purpose!

In addition to working in Exploratory, I am learning the ins and outs of Adobe InDesign, which will be used for page layout, titling, fonts, styles, colors, and any other elements used for book publishing. I have yet to decide how I’ll publish the various versions of the book, other than being fairly certain there will be both e-book and printed versions. Full color printed books can become very expensive to print, so I’m wrestling with a variety of approaches at this stage to maximize readership while also having a print version available at a potentially high price point.

I’ll provide updates as my work progresses, including potential section and chapter content, release dates, and so on. In the meantime, thanks for reading, and let me know your thoughts through my Substack site at Visual Excursions. See you soon!
Final WAR Trade Networks Published

The final 10 MLB WAR Trade Networks have now been published, bringing the total number of graphs to 31 – 30 teams and one overall network with all teams and transactions. For more information on the trade networks, click here. Here are the remaining networks:

Find your favorite teams and enjoy!

First 10 WAR Trade Networks Published!

The first 10 WAR (Wins Above Replacement) Trade Networks are now available for exploring! This initial group includes nine team networks and one overall graph with all teams included. Here’s a list of the 10 graphs:

Each of these and any upcoming WAR trade networks can be found on this page.

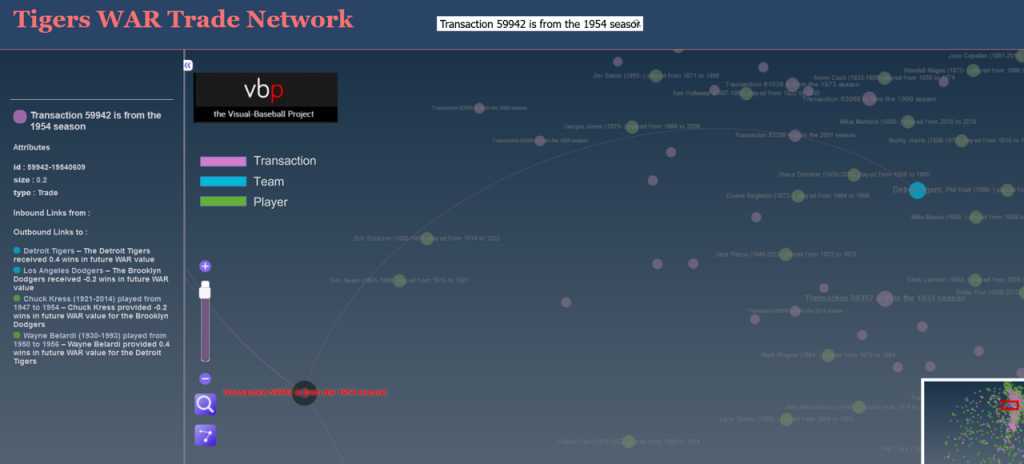
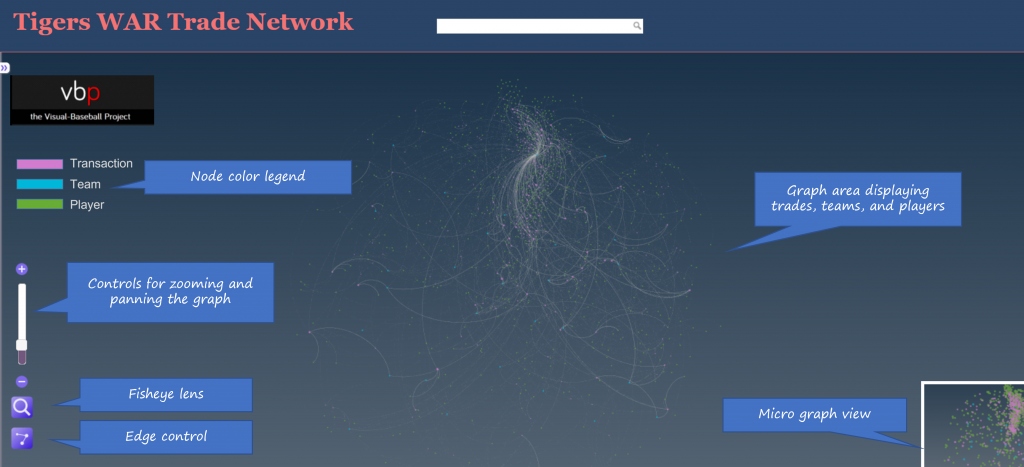
Let’s walk through how the graphs work, using the Detroit Tigers network as an example. We’ll begin with an anatomy of the graph display:

As the image shows, the primary focus will be the main graph area in the center of the window. This is where all nodes (transactions, teams, and players) will reside, connected by edges based on common relationships. Transaction nodes will vary in size based on the total value of a trade with the largest nodes indicating a trade that created significant future WAR for one or both teams. Team and player nodes are set to constant sizes so that the initial visual focus will be on the transaction nodes. The size differences become more noticeable when we zoom in to the network. More on that shortly.

Edges are also sized based on WAR value; this is where we see the value provided to a team and by specific players. Edge sizes (weights) will be more easily seen when we zoom in to the network.

On the left are some graph controls to assist in navigating the graph. We can zoom in using the slider control or the plus/minus buttons adjacent to the slider. Zooming can also be done with a mouse scroll if you prefer that option. The fisheye lens can be toggled on or off and can be used to highlight certain areas of the graph by hovering over a selected region. Finally, the edges button will enable showing or hiding edges and connected nodes. This is useful when you wish to reduce surrounding nodes and focus on specific transactions. We can also pan the graph by dragging it using a mouse – this is helpful in centering a network or viewing specific regions of the graph.

At the upper left of the window is a color legend for each node type, and hidden on the left (not shown in our image) is an information pane that will show specifics about the network. More on that in a bit.

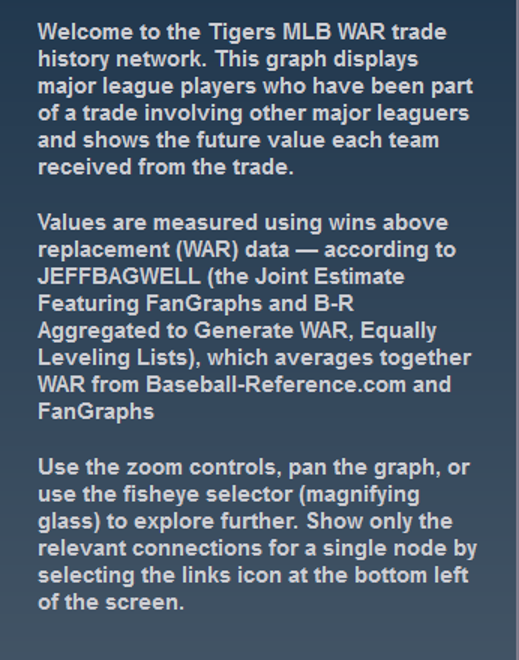
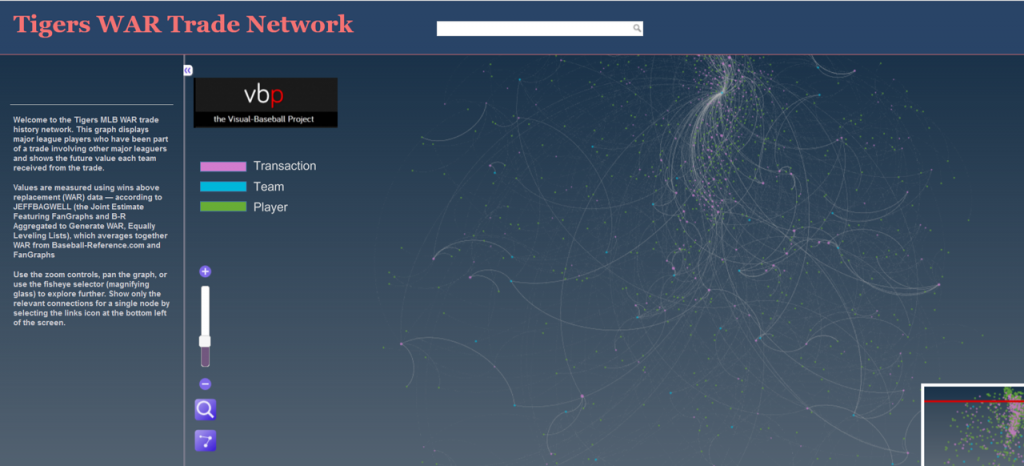
Now let’s examine the information window – this is what makes the network truly powerful. When the network is first displayed or the browser window is refreshed the information pane displays information about the graph (open it by clicking on the arrows icon at the top left):

You can see the simple overview of the graph, the source data, and what it aims to accomplish. Here’s an enlarged version for easier reading:

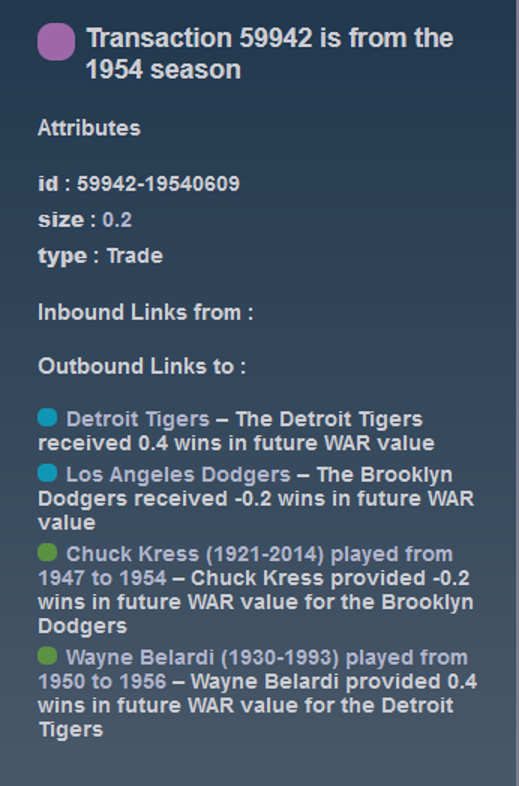
If we zoom in and select a specific transaction the pane displays the relevant details for that selection:

Now we have the details for the transaction – the season, teams, and players involved. Here’s the enlarged view:

You can do this for any transaction in a graph, or you could choose to select a team or player to see how they fit into the network. The possibilities are nearly endless and it’s a fun way to understand the relationships between teams, players, and trades.

We’ll do more exploring of the networks in upcoming posts; I’ll also be adding more teams until we have a complete set of trade networks. In the meantime, feel free to explore the graphs to learn more about the best (and worst) trades your favorite team has made over the last 120 years. Enjoy, and thanks for reading!