Category: Batting Explorers

2019 Batting Explorer Updates Complete

Welcome to Visual-baseball.com! I’ve just completed an update where data for the 2019 season is now part of the Batting Explorer 2010-2019 interactive visualization. This is a tool where we have every batter in a given season depicted via a baseball card type of framework, showing their key stats for the season, as well as the positions played in the field (by number of games), using a visual of a baseball diamond. It’s a highly interactive way to filter through multiple seasons worth of data by team, player, position, and more.

So while you’re waiting for on the field action to start, have a look at the Batting Explorer to answer some of the questions on your baseball mind. For example, here’s a quick look at all of the left fielders who played at least 110 games at the position in 2019 (by using the filters pill at the top left):

We can take the same results and sort it by the number of home runs, to see who the power hitters in the group were for 2019, by sorting from high to low:

Now we see Kyle Schwarber and Juan Soto at the top of the display. Let’s look at Schwarber’s details by simply hovering over his card:
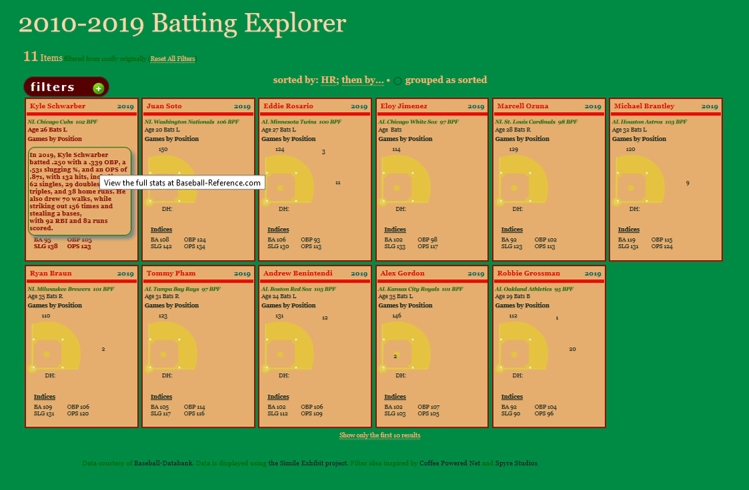
We now have a pop-up within Schwarber’s card telling a mini-story about his batting stats for the 2019 season. Here’s a closer look:
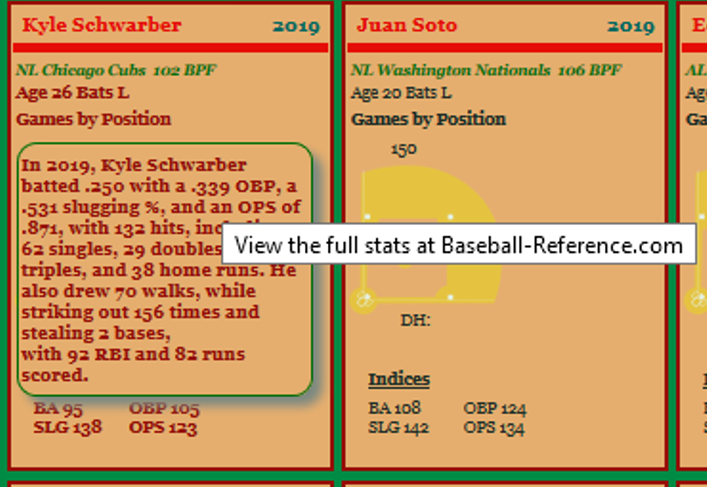
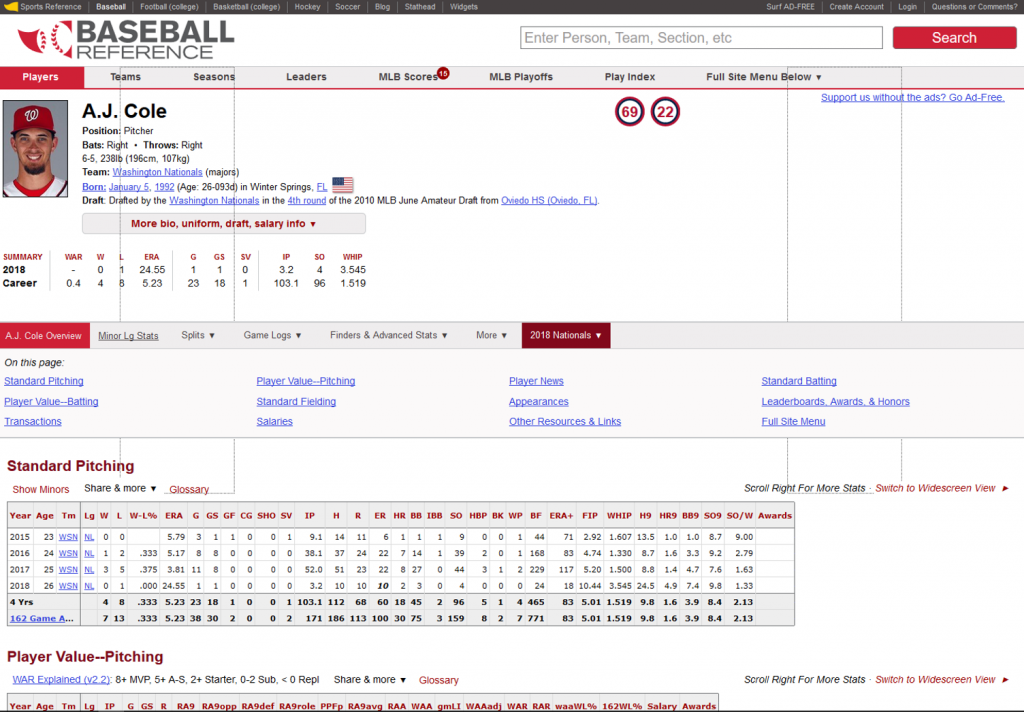
From this, we learn that Schwarber hit 38 home runs, batted .250, and had an OPS (on-Base + Slugging) of .871, as well as multiple other details. Additionally, you likely noticed the “View the full stats at Baseball-Reference.com” pop-up tag. To get there, simply click on Schwarber’s card, and you’ll be transported (in a new tab) to his page at Baseball-Reference:
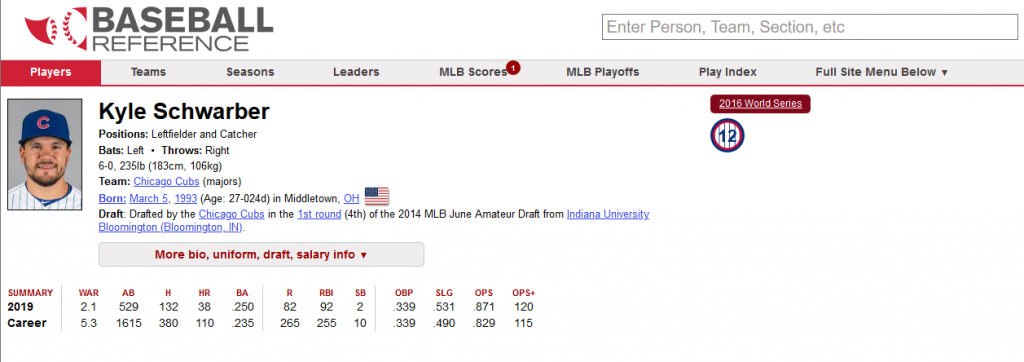
Pretty cool, right? Give it a try, or pick your own filters, look at specific teams and seasons, and so on. Here’s the Batting Explorer page, with every decade back to 1900-1910 available for your curiosity.

More updates to come soon on the 2019 data, and thanks for reading!

Batting Explorer 2018 Data Updated

I’m happy to announce that the 2010-2019 version of the Batting Explorer has been updated with 2018 stats, courtesy of the kind folks at seanlahman.com and baseball-databank.

The Batting Explorers were built using the Exhibit software from the MIT Simile project. A wide array of facets (filters) enable searching, sorting, and data discovery in a fun manner, with every batter having his basic stats packaged in a representation of a baseball card. Here’s a screenshot of some 2018 cards:

For the full roster of Batting Explorers dating back more than 100 years, click here. Enjoy!

Batting Explorers Updated Through 2017 Season

I’m pleased to share that the Batting Explorer visualization for the 2010s decade has now been updated with 2016 & 2017 statistics. This ongoing project captures batting statistics at the season level for every major league batter, and visualizes them in a baseball card type of format, as seen below:

Batting Explorer
Batting Explorer

A number of filters are provided to make it easy to browse across a wide range of attributes, including all of the major batting categories:

Filters
Filters

One of my favorite aspects of the Batting Explorer is the ability to link to greater detail by clicking on a specific player card, which will transport you to the Baseball-Reference page for that player:

baseball_ref_1

This project uses the Exhibit project software originally developed years ago as part of the MIT Simile project, as well as a lot of HTML & CSS for styling purposes. Give it a try, and thanks for reading.

Updated Batting Explorer Baseball Visualizations

One of my ongoing visualization projects has been the Batting Explorer, a semantic-based discovery concept built using the Simile Exhibit open source tools. I’ve been updating this on a not very timely basis the last few years, but have now caught up through the 2015 season. Of course, 2016 stats will be available in the next 2-3 months, so it will be time to repeat the process once more. For the moment, I’ve just added the 2014 & 2015 seasons into one of the decade-based examples, so you can now search for all batters covering seasons from 1901 through 2015.

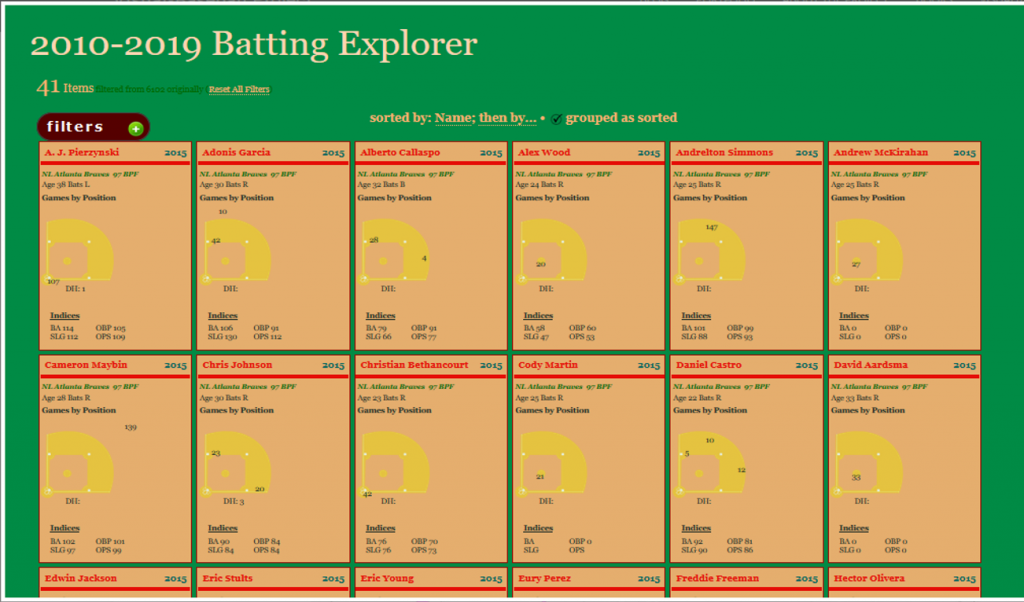
The explorers work in much the same way as many travel sites you’ve visited on the web. Each page can be filtered using a wide array of facets (filters) that allow you to quickly narrow down results by team, season, batting category, and a bunch of other options. I’ll show this in a moment. Let’s first start with a basic view of the 2010-15 explorer:

Batting Explorer
Batting Explorer

Each of the Batting Explorers has a consistent look & feel, with the underlying data as the only difference. All individual player-season combinations are laid out in a baseball card sort of format, although you can’t flip them over or get any bubble gum either 🙂 Nonetheless, each card contains a wealth of information, including the number of games played by position, laid out on a baseball diamond. In addition, hovering over a card loads a pop-up summary of the season for each individual batter, as seen here:

Mouseover for Info
Mouseover for Info

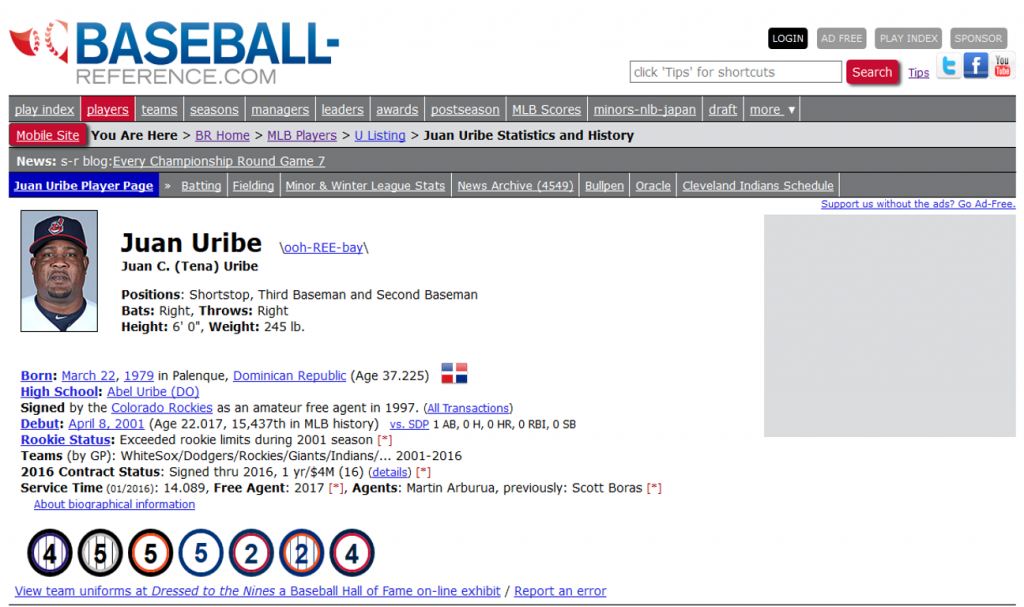
An additional benefit comes when you click on a selected card. Every batter card has a personalized link to the massive Baseball-Reference.com site. Here’s what you’ll see when clicking on the Juan Uribe link:

Juan Uribe at Baseball-Reference

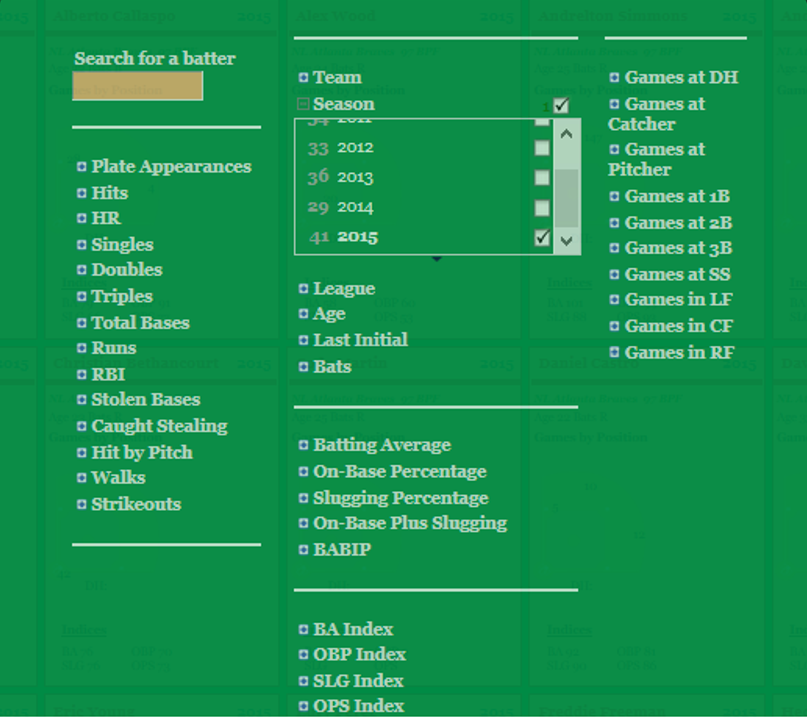
I mentioned earlier the ability to filter using a wide range of facets. Here’s a glimpse of the many categorical and numerical options present in each Batting Explorer:

Filters
Filters

As you can see, there are dozens of possible filters that can be used. If you want to see only batters with more than 40 home runs in a season, simply select the HR facet and check the conveniently provided ranges. Or how about viewing players from a single team? Simple, using the Team facet. Likewise for filtering by season, number of doubles, stolen bases, walks, strikeouts, and so much more. And of course these filters can be used together to quickly find matching results.

Finally, there are a multitude of sort capabilities, or you can choose to have nothing sorted. If you do wish to choose one or more sort attributes, here are your options:

Sort options
Sort options

Your sorts can be many layers deep – just keep adding variables!

This has been a very brief overview – to learn more, go to the Portfolio section and begin exploring! While you’re on the site, take some time to view the Game Summary exhibits, set up in much the same fashion using Exhibit. Or, if networks are your thing, check out a large collection of franchise player or team trade networks. Hope you enjoy the site, and thanks for reading.

Batting Explorers