Welcome to the first countdown post in our series of MLB team rankings for the 1990s. As a reminder, the teams are ranked from #20 through #1 based on aggregate WAR162. For the 1990s (1990-1999), a total of 278 team-seasons were eligible, so the top 20 teams are a rather exclusive group – the top 7% for the decade. The 90s were a challenge, with two short seasons due to contract issues. The 1994 season fell well short of the 162-game schedule, with most clubs playing just 115 games. In 1995, most teams played about 140 games. I’ve elected to include both seasons, given that WAR162 adjusts for the number of games played. We’ll summarize each team, including those from 1994-95, and include portions of their team dashboard. Then we’ll explain how they attained their ranking. So, without further ado, here are the teams ranked #20 through #16.
Here’s the interactive dashboard at Tableau Public: 1990s Top 20 MLB Teams Dashboard
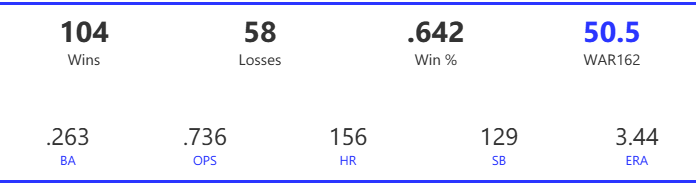
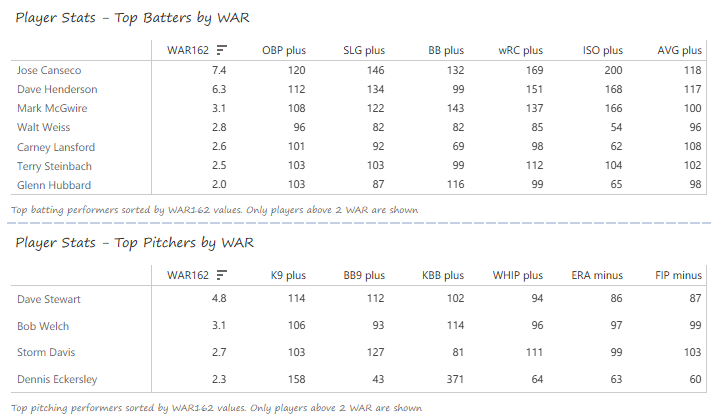
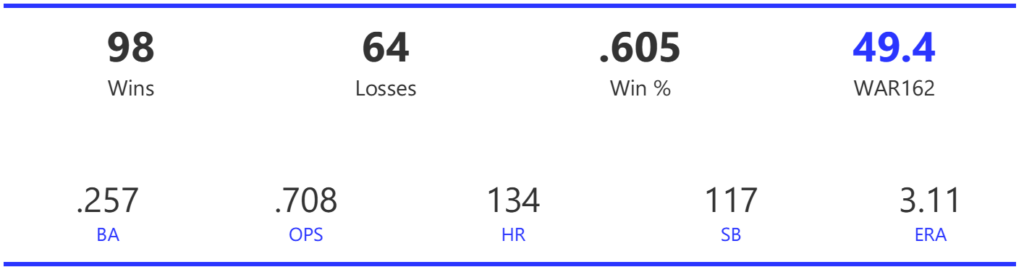
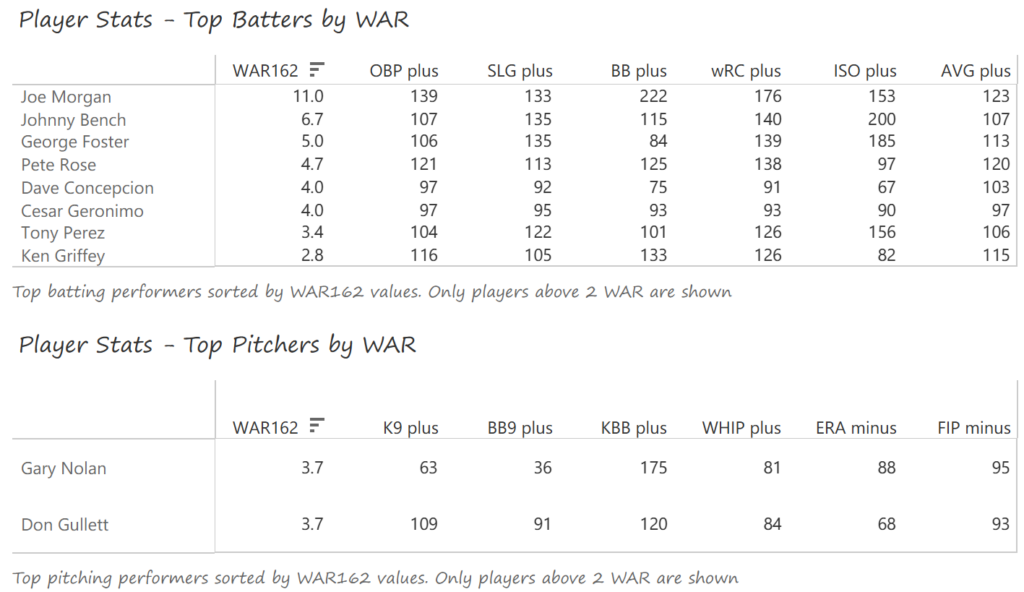
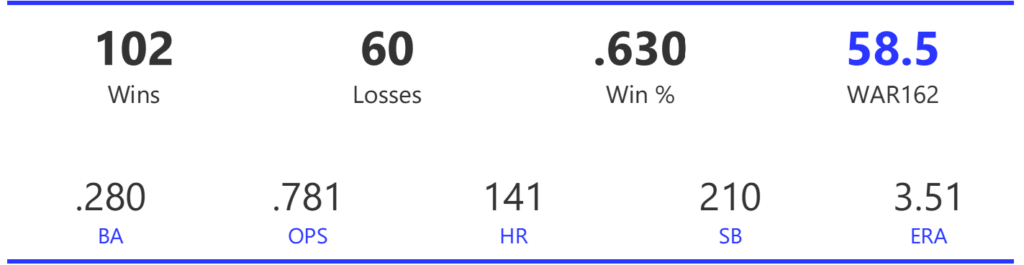
#20: 1994 Cincinnati Reds, 49.8 WAR162
The Reds wound up a half-game ahead of the Astros in the NL Central when the season came to an early ending. With no playoffs or World Series in 1994, the Reds could only wonder what might have happened in a full season.
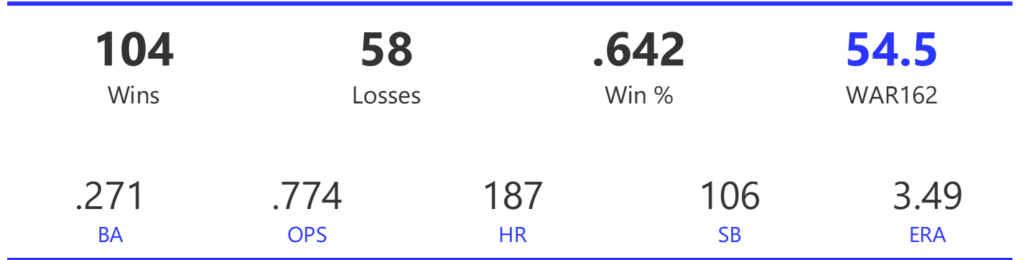
The Reds featured a strong offense, scoring 609 runs in their 114-game season. Their 124 home runs placed third, as did their 119 steals. The team also swept the BA, OBP, SLG, and OPS metrics. The Reds’ pitching was solid if unspectacular. The staff finished third in ERA and WHIP, and second in strikeout-to-walk rate.
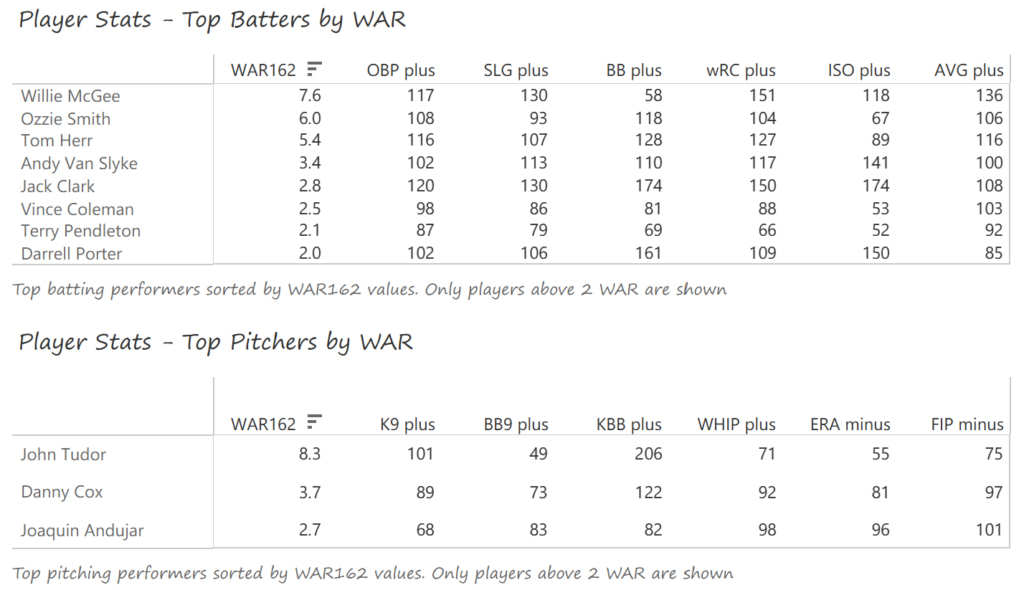
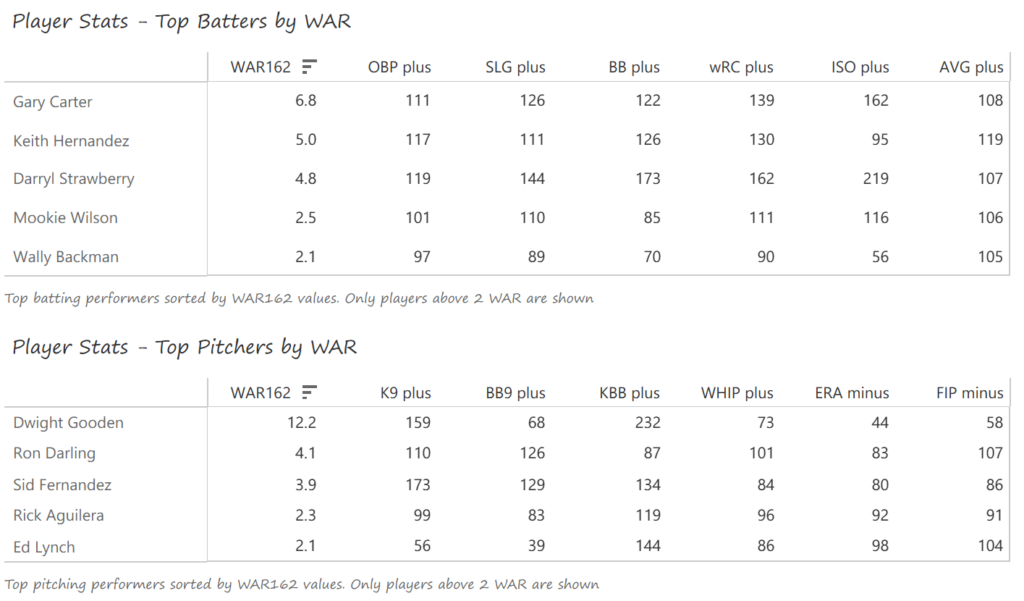
Three players set the tone for the Reds’ offense and defense in 1994. Kevin Mitchell clouted 30 homers in just 95 games played, with a .326 BA, .429 OBP, and 1.110 OPS. Barry Larkin batted .279 with 26 steals and a Gold Glove at shortstop, and Reggie Sanders stole 21 bases, rapped 17 home runs, and drove in 62 runs. Jose Rijo (9-6, 3.08 ERA, 171 strikeouts) and John Smiley (11-10) were the Reds top starters. Chuck McElroy and Jeff Brantley (15 saves, 2.48 ERA) provided strong bullpen support.
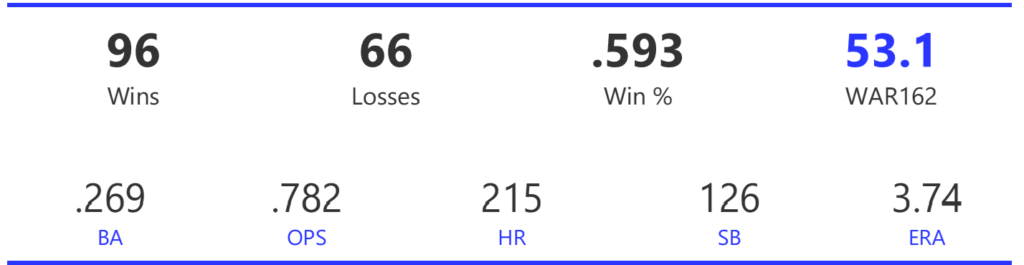
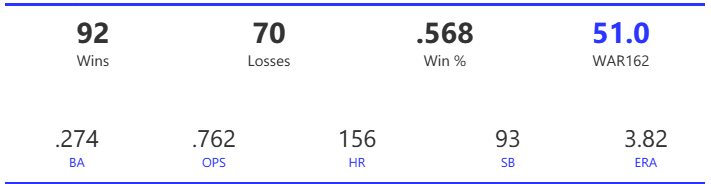
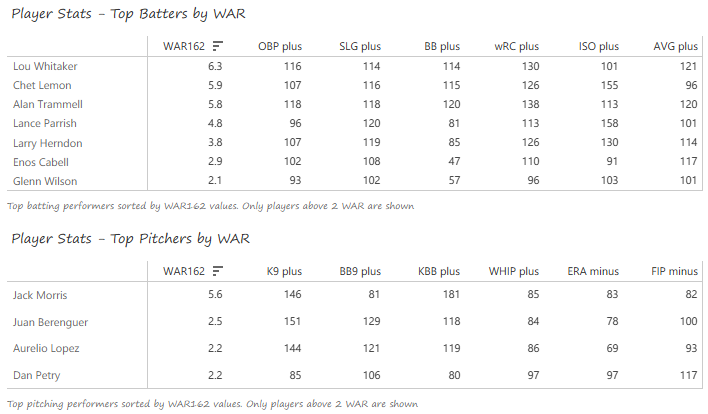
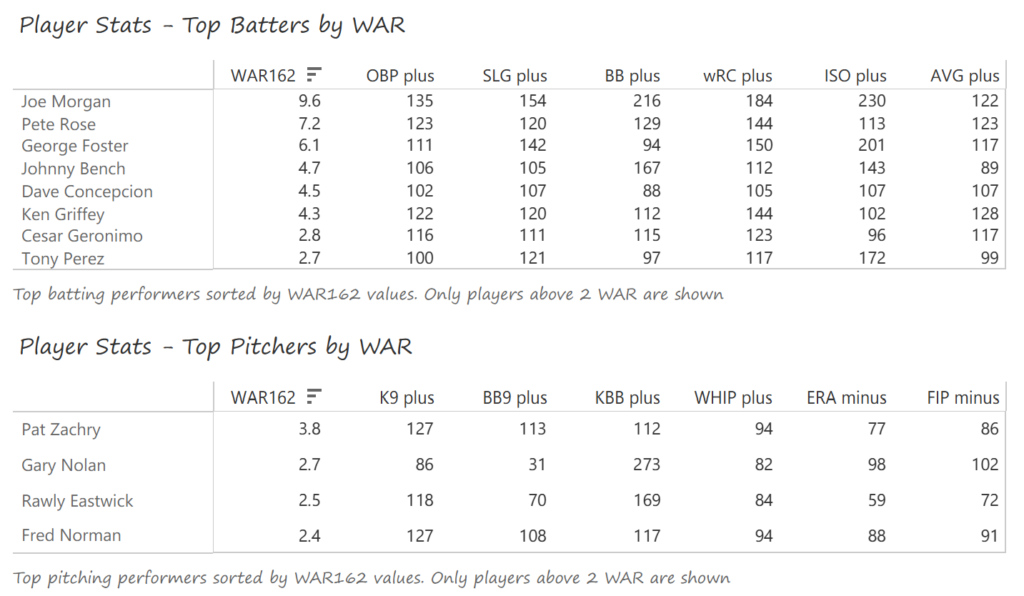
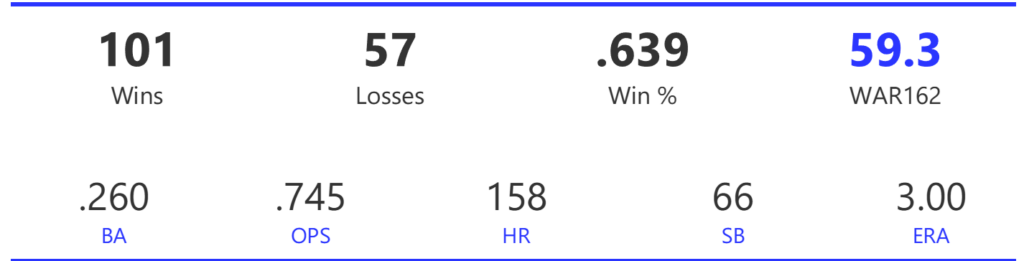
#19: 1994 Cleveland Indians, 50.4 WAR162
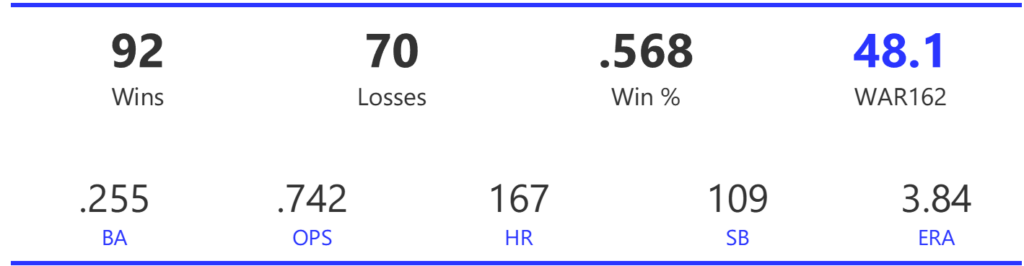
The 1994 Indians provided a glimpse of the future, as they would become one of the dominant AL teams for the remainder of the decade. They wound up one game behind the White Sox in the AL Central when the season ended early.
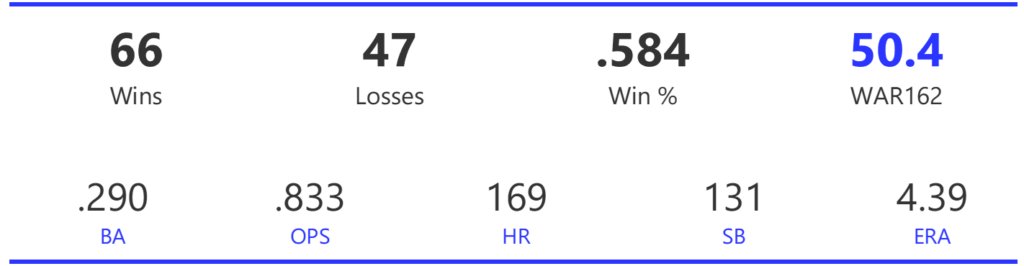
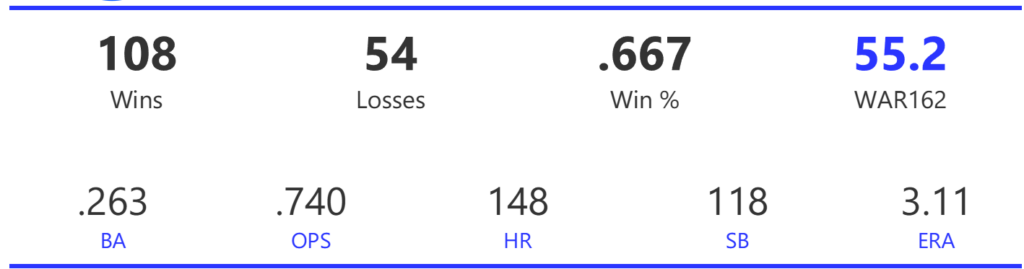
The Indians had a powerful offense, leading the AL in runs, home runs, doubles, and BA, and ranking second in stolen bases and OPS, a hair behind the Yankees. The pitching staff was less dominant, ranking fifth in ERA and sixth in WHIP. However, they surrendered the fewest home runs in the AL, helping to keep games within reach for their powerful offense.
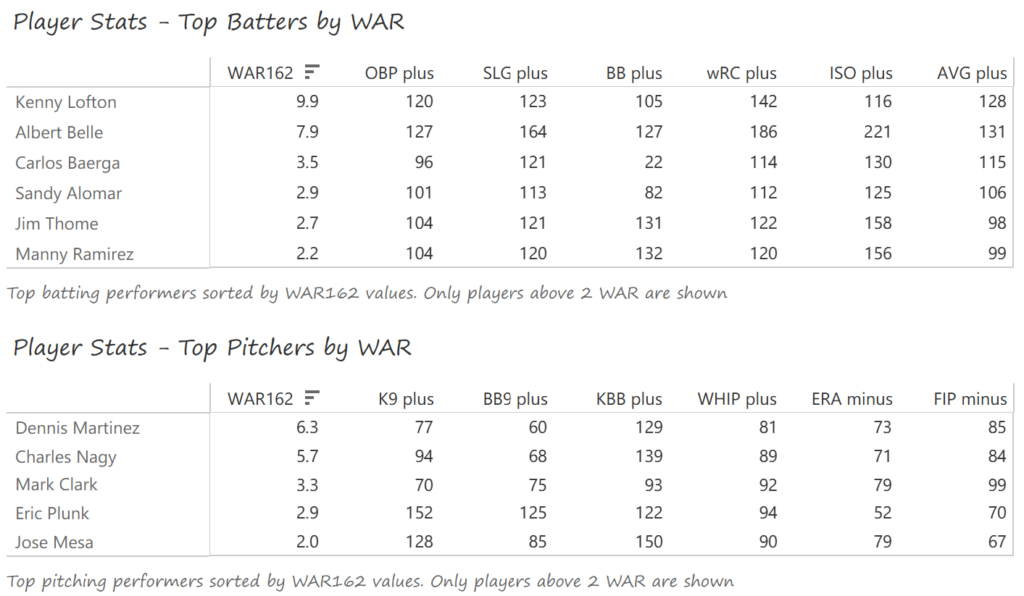
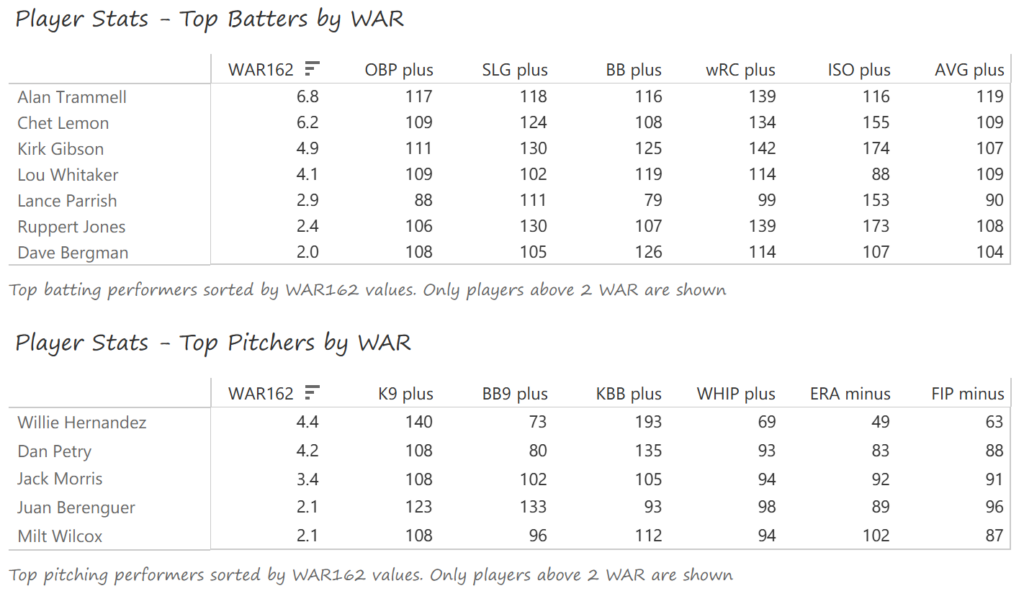
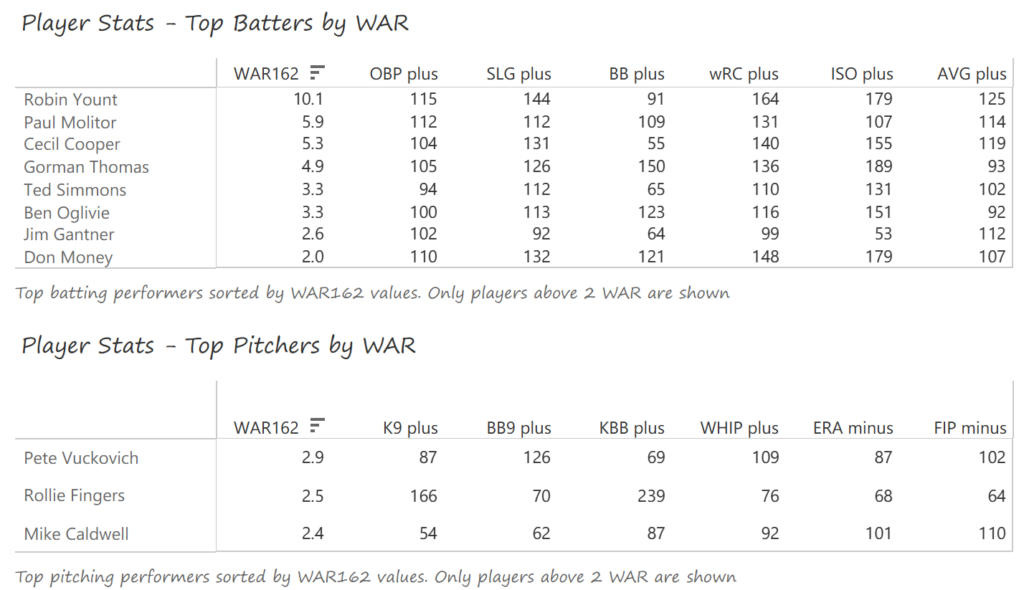
Center fielder Kenny Lofton was dynamic, batting .349, scoring 105 runs, and stealing 60 bases in just 112 games. Lofton also claimed a Gold Glove Award. Albert Belle provided the power, slugging 36 homers with 101 RBI and a .357 BA across 106 games. Second baseman Carlos Baerga batted .314 with 32 doubles, 19 home runs, and 80 RBI to round out the Indians’ top three. Dennis Martinez had a splendid age-40 season, posting an 11-6 record with 3 shutouts. Charles Nagy recorded a 10-8 record with a solid 3.45 ERA in the high-scoring 1994 environment. Mark Clark added an 11-3 record for the Indians.
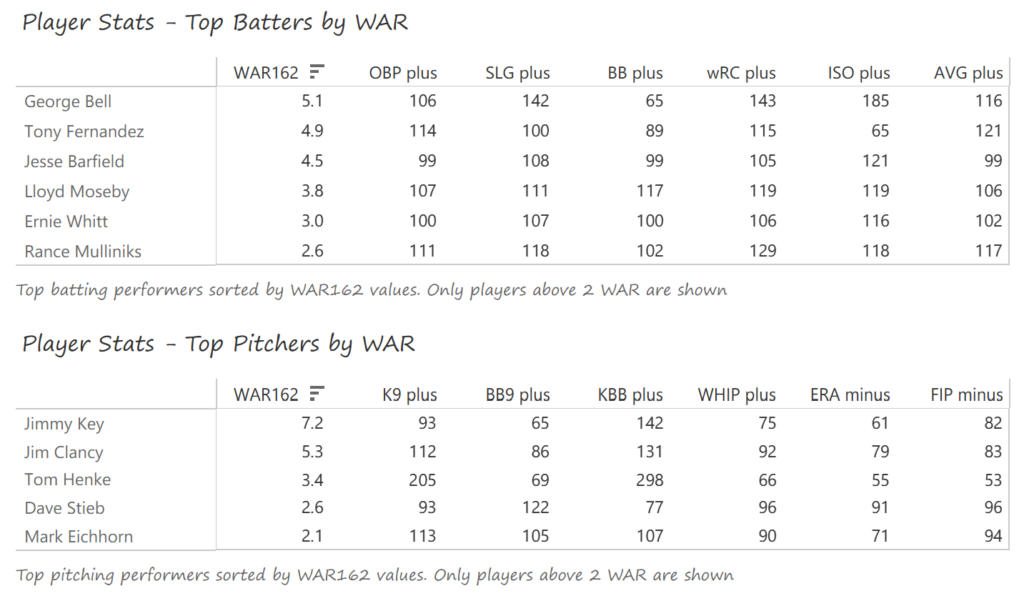
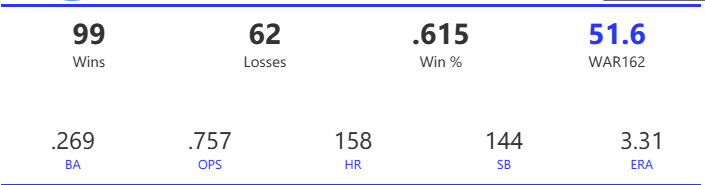
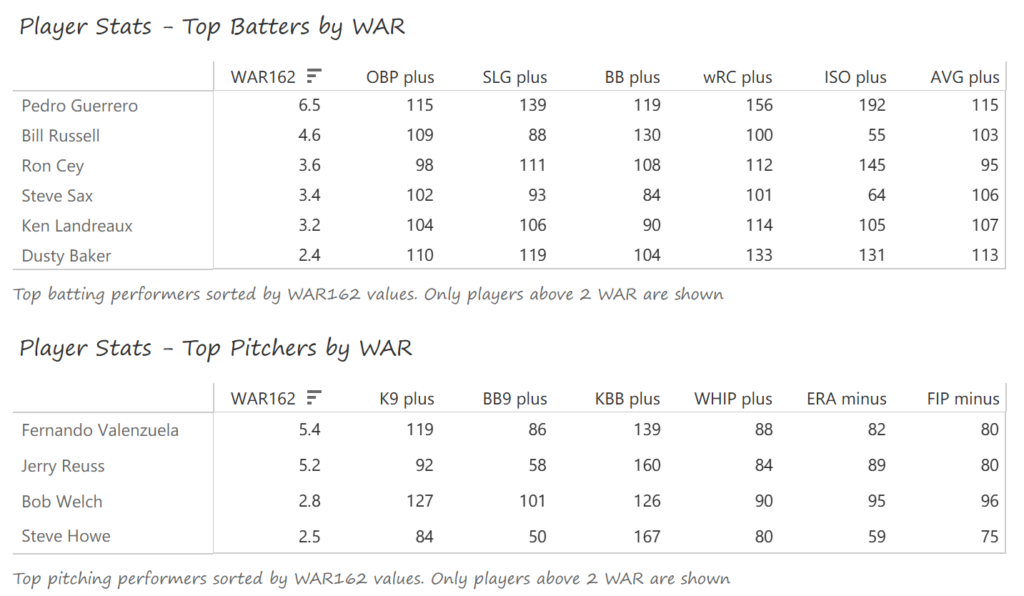
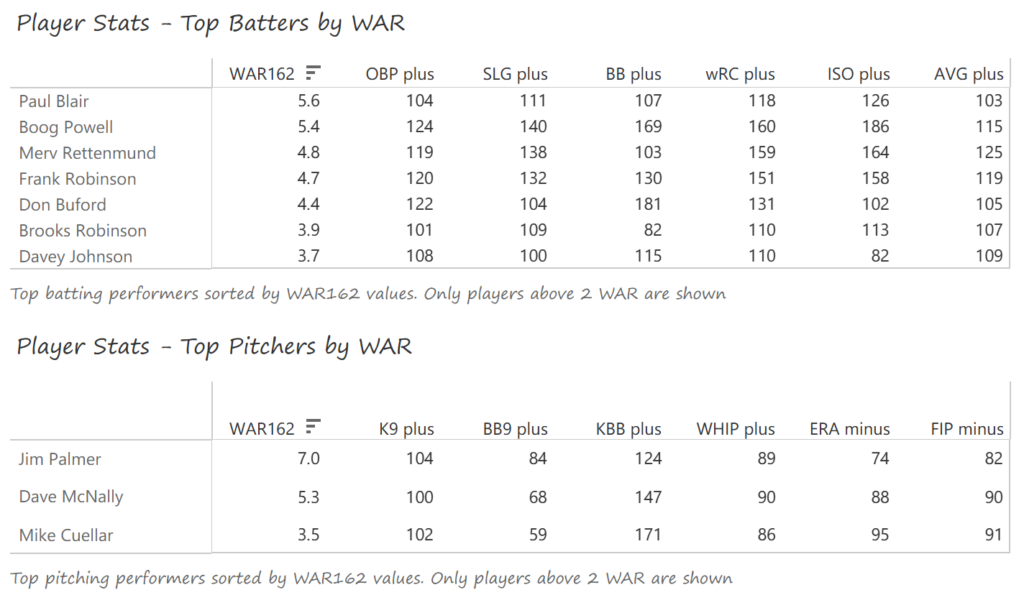
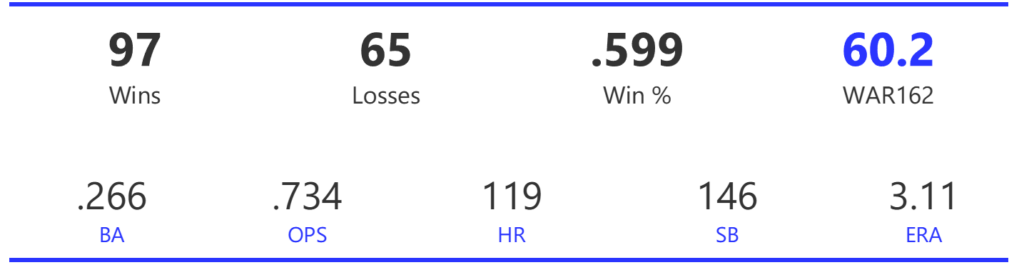
#18: 1996 Atlanta Braves, 50.4 WAR162
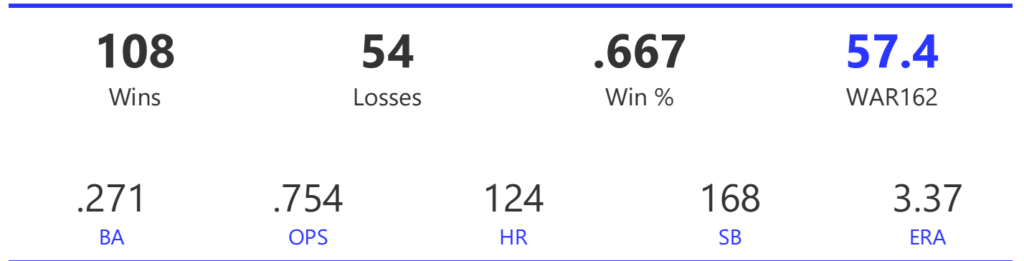
The 1996 Braves captured the NL East title by 8 games over the Expos. They went on to sweep the Dodgers in the NLDS round and defeated the Cardinals in a seven-game NLCS. Their run came to an end with a six-game World Series defeat at the hands of the Yankees.
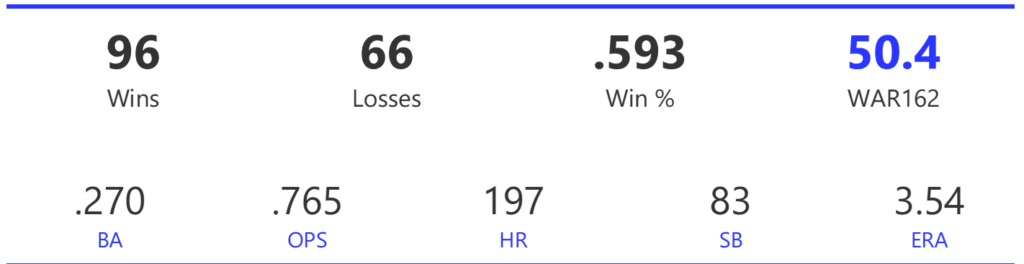
The Braves scored 773 runs on the season, good for 4th place, and just 5 runs behind the second-ranked Reds. Their 197 homers ranked second, as did their .270 BA and .765 OPS. Pitching is where Atlanta distanced itself from most rivals, with a staff that ranked first in WHIP, strikeouts, walks, and strikeout-to-walk rate. They also ranked a close second to the Dodgers in ERA.
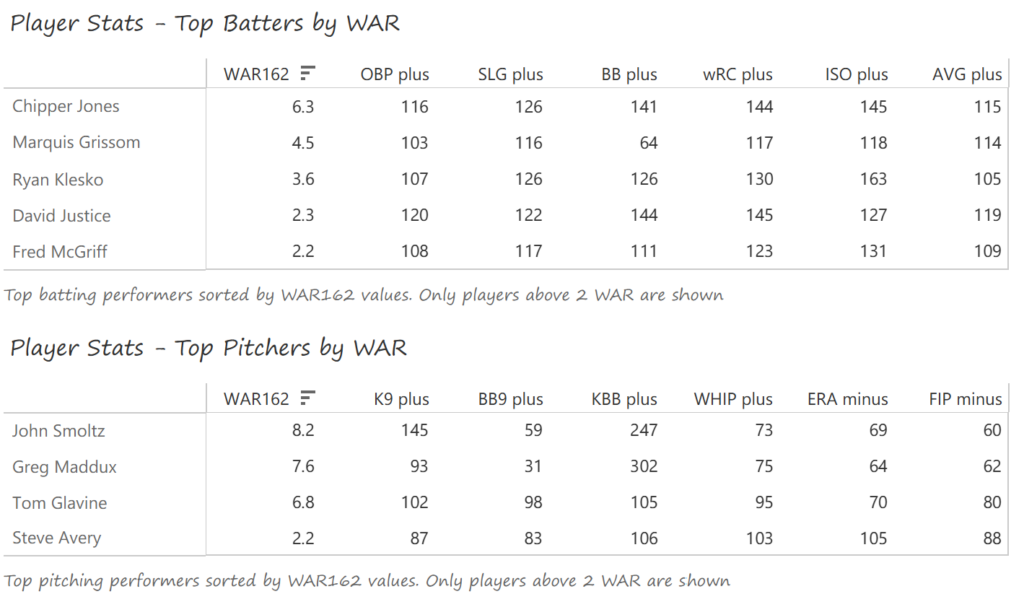
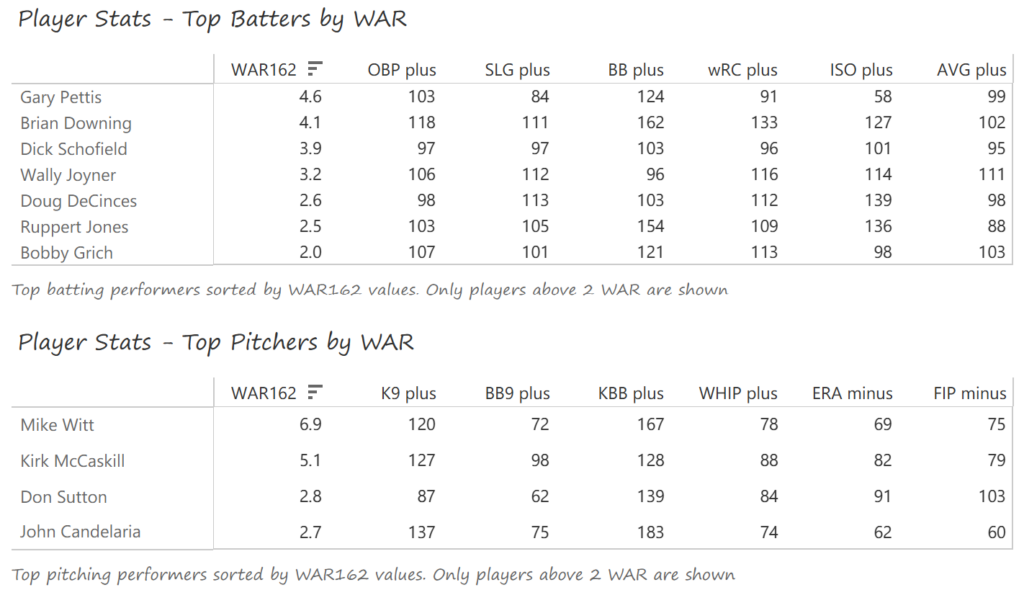
Third baseman Chipper Jones paced the offense, batting .309 with 30 homers, 110 RBI, and 114 runs scored. Marquis Grissom (.308 BA, 28 steals, 23 homers, 106 runs) won a Gold Glove in addition to his offensive numbers. Slugger Ryan Klesko launched 34 homers with 93 RBI as the third member of the Braves offensive nucleus. On the mound, John Smoltz earned the NL Cy Young Award with a 24-8 record and 276 strikeouts, both tops in the league. Greg Maddux went 15-11 with a 2.72 ERA and issued the fewest walks per inning in the NL, and Tom Glavine posted a 15-10 mark and 2.98 ERA.
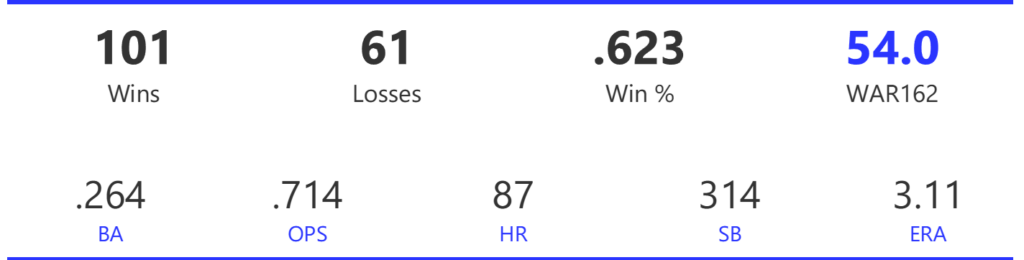
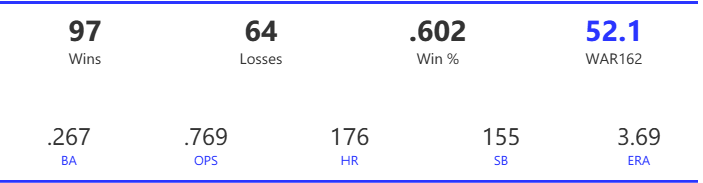
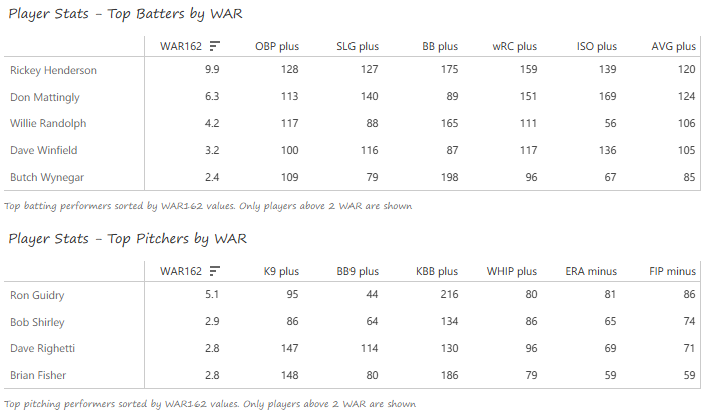
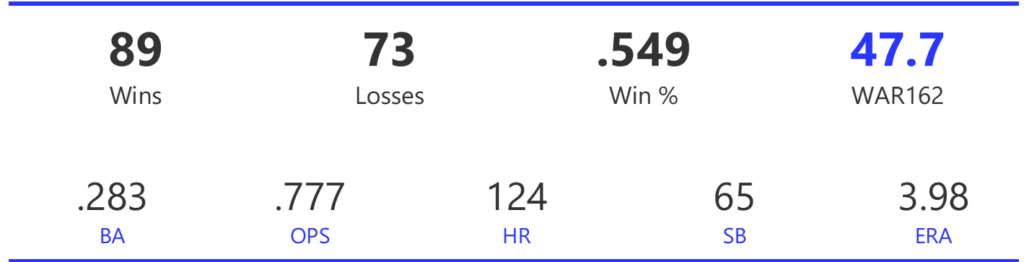
#17: 1997 New York Yankees, 50.7 WAR162
The Yankees finished two games behind the Orioles in the AL East, earning a wild-card berth in the playoffs, where they were defeated in five games by the Indians. Their Pythagorean win projection was 100 victories, so they were actually slightly unlucky during the regular season.
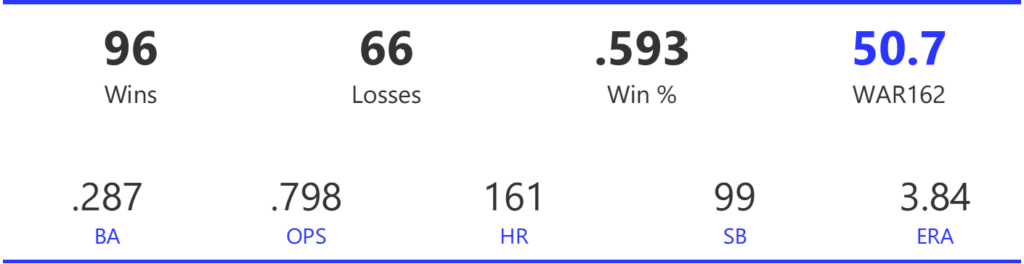
The Yankees rode a high-scoring offense to 96 wins; their 891 runs trailed only Seattle. The Yankees ranked second in BA on the season, first in OBP, and fourth in OPS in the 14-team American League. On the pitching side of the ledger, the New Yorkers ranked first in ERA, second in strikeouts and strikeout-to-walk rate, and third in WHIP for the 1997 season.
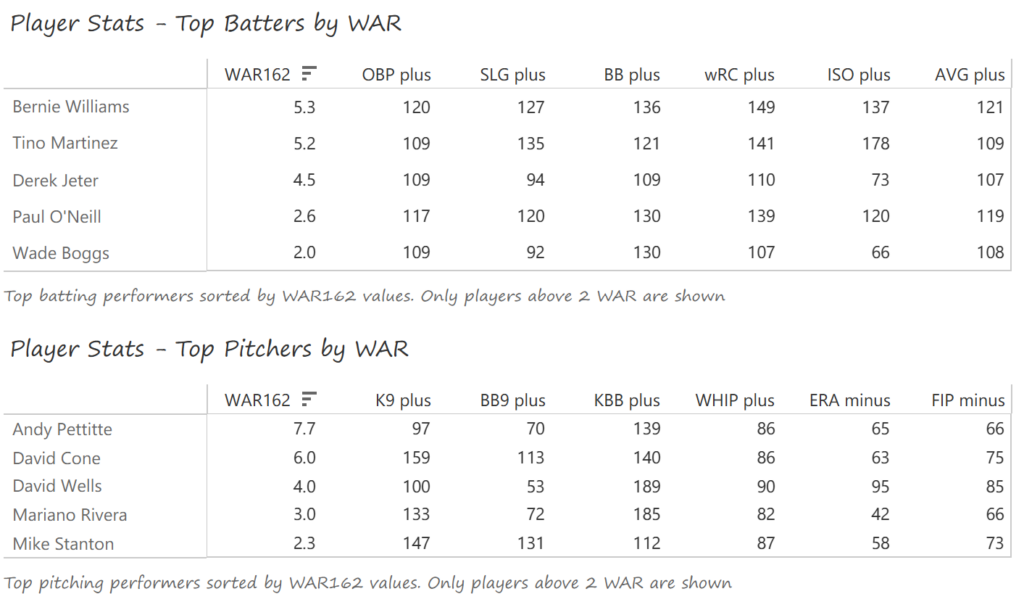
Bernie Williams, Tino Martinez, and Derek Jeter spearheaded the Yankees offensive efforts. Williams batted .328 with 21 home runs, 100 RBI, and 107 runs scored while winning a Gold Glove in center field. Martinez batted .296 with 44 homers and 141 RBI, and Jeter batted .291 with 116 runs scored and 23 steals. The Yankees had a strong starting rotation, led by lefty Andy Pettitte, who assembled an 18-7 record with a 2.88 ERA. Veteran David Cone posted a 12-5 mark with 10.2 strikeouts per 9 innings, and David Wells added 16 wins. Closer Mariano Rivera saved 43 games with a 1.88 ERA to support the rotation.
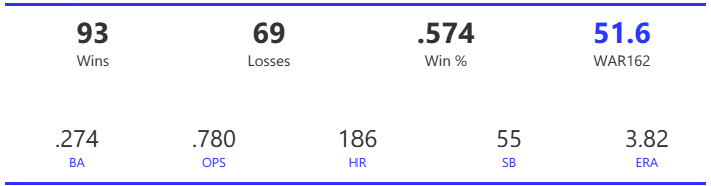
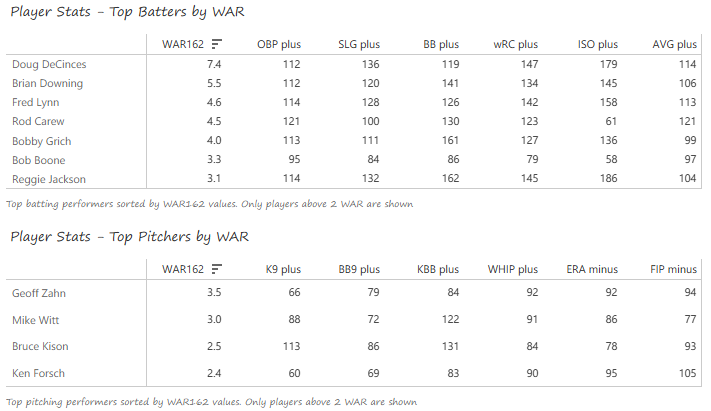
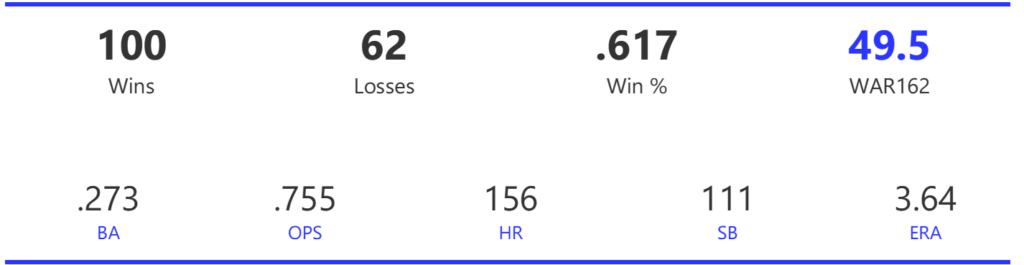
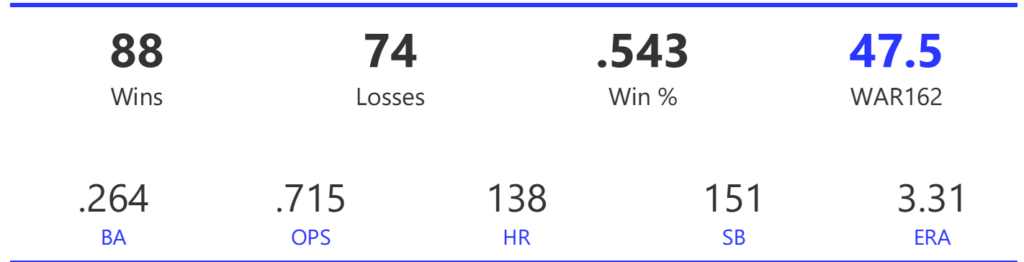
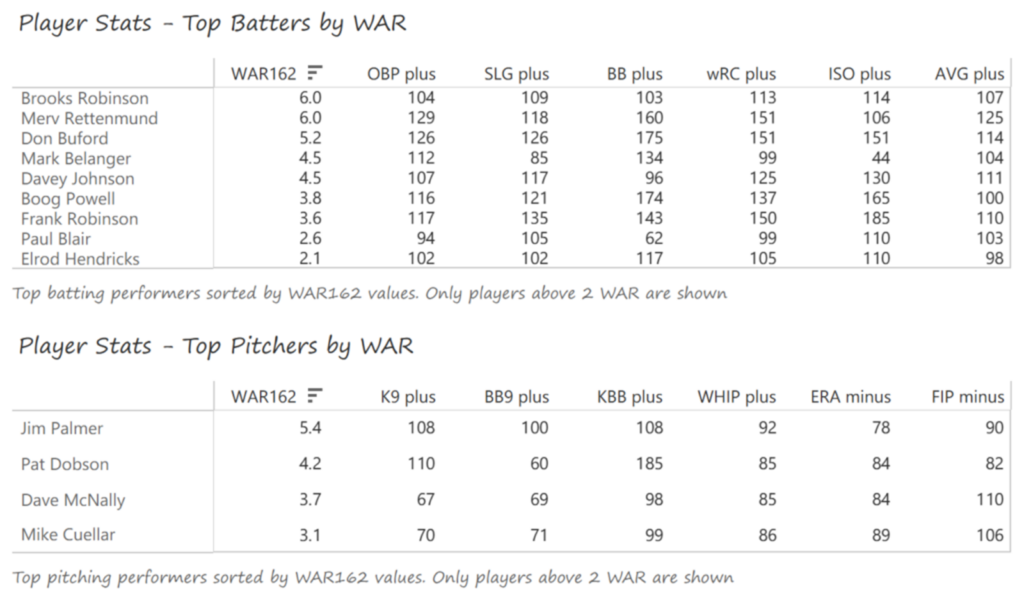
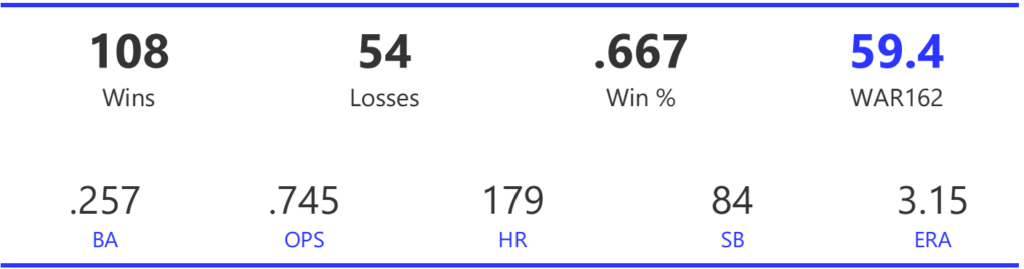
#16: 1994 Baltimore Orioles, 50.7 WAR
The Orioles were another of the 1994 clubs left to wonder what could have happened in a full season. At the time of the early stoppage, they were 6.5 games behind the Yankees in the AL East.
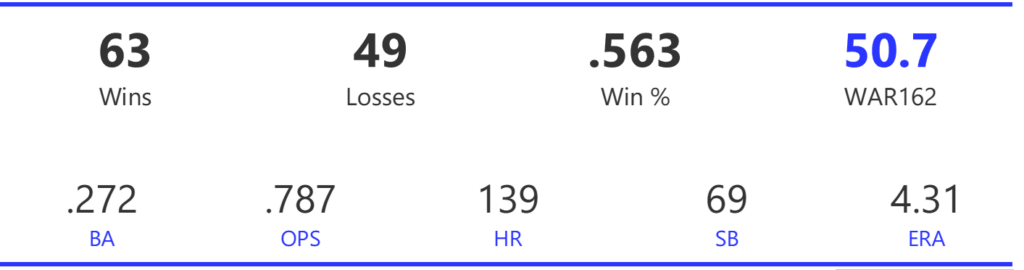
The Orioles’ offense was somewhat ordinary in 1994, ranking 7th in runs scored and tied for 4th in home runs at the end of the season. They had similar ranks in BA (6th), OBP (6th), and OPS (6th). Pitching was a strong suit, with the Orioles staff ranking third in ERA, second in WHIP and strikeout-to-walk rate, and first in issuing the fewest walks.
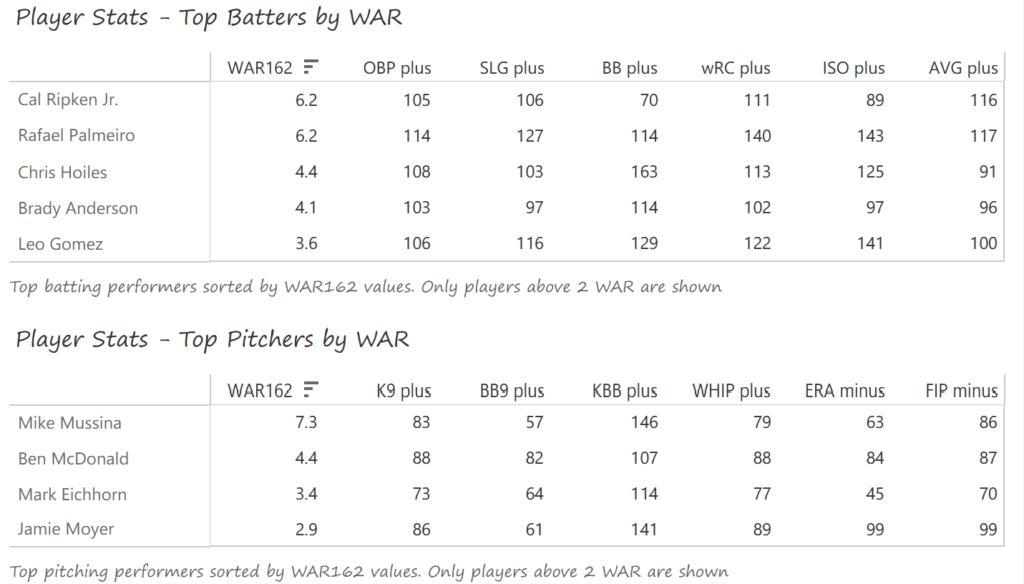
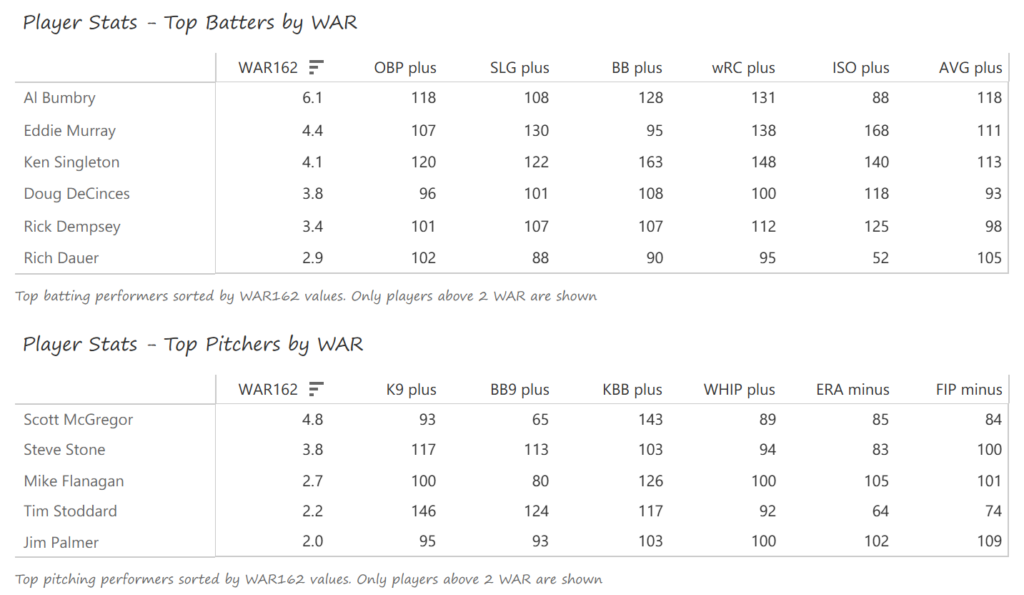
Cal Ripken, Jr. enjoyed a fine age-33 season, batting .315 with 13 homers and 75 RBI in 112 games. Rafael Palmeiro slugged 23 homers and batted .319, while catcher Chris Hoiles added 19 homers in 99 games. Brady Anderson stole 31 bases (in 32 attempts) and scored 78 runs for Baltimore. Mike Mussina posted a 16-5 record in 24 starts, and Ben McDonald added 14 more wins. Reliever Mark Eichorn recorded a 2.15 ERA across 43 appearances in the shortened season.
Summary
That’s it for the first entry in our MLB Team Rankings for the 1990s decade! Stay tuned for the countdown from #15 to #11, arriving in a few days. As always, thanks for reading!