Month: February 2026

Tableau MLB Team Dashboard (1901-1909) Is Live

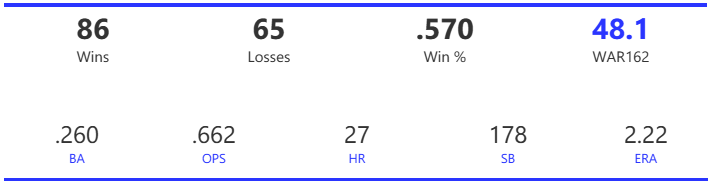
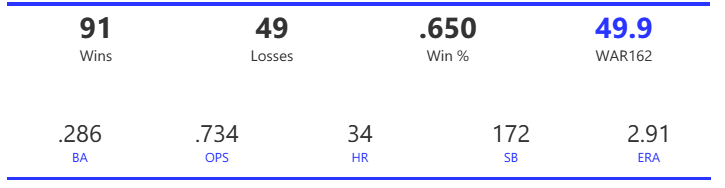
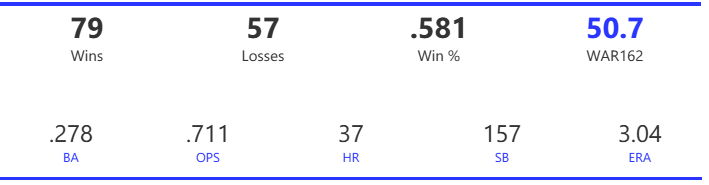
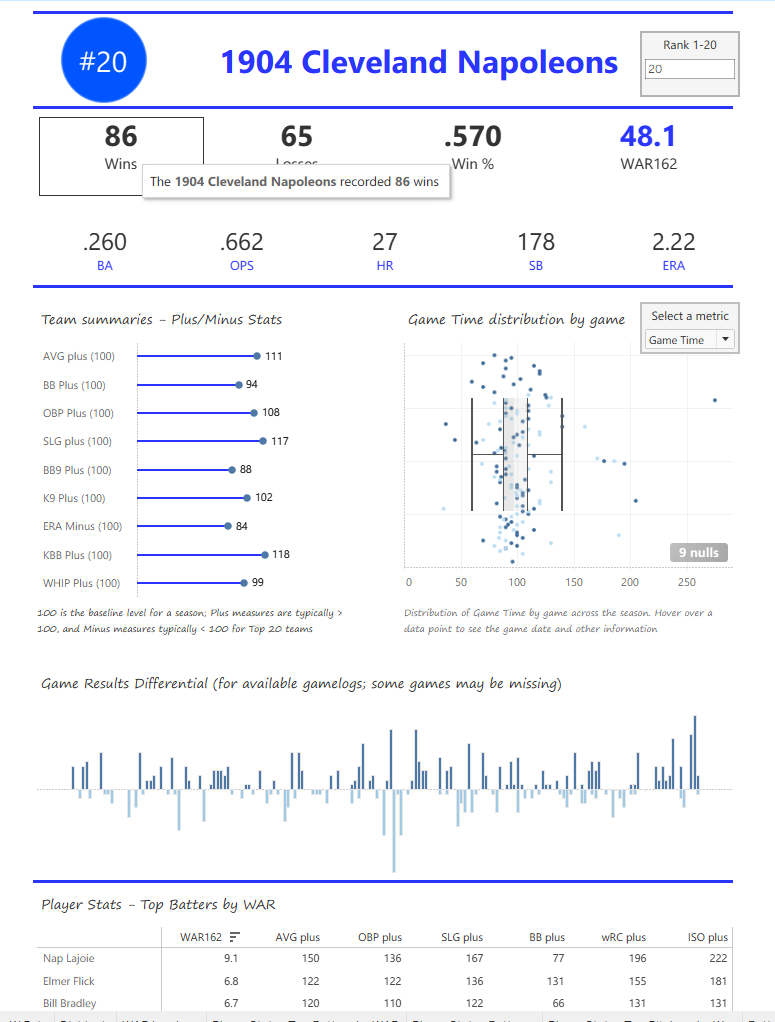
The first MLB Team Dashboard is available on Tableau Public – Top 20 Teams, 1901-1909. The dashboard provides the data for my Top 20 MLB Teams countdown, which starts today with teams #20 through #16 from the same decade. Here’s a look at the dashboard:

Users can interact with the MLB Team Dashboard 1901-1909 in multiple ways:

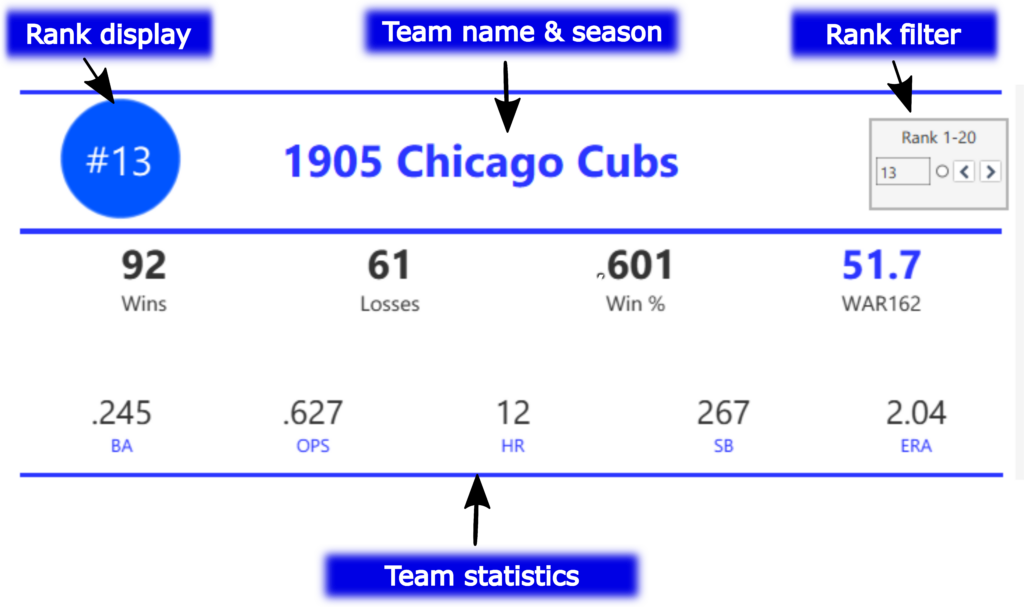
  • By inputting a number between 1 and 20, to see the corresponding ranked team
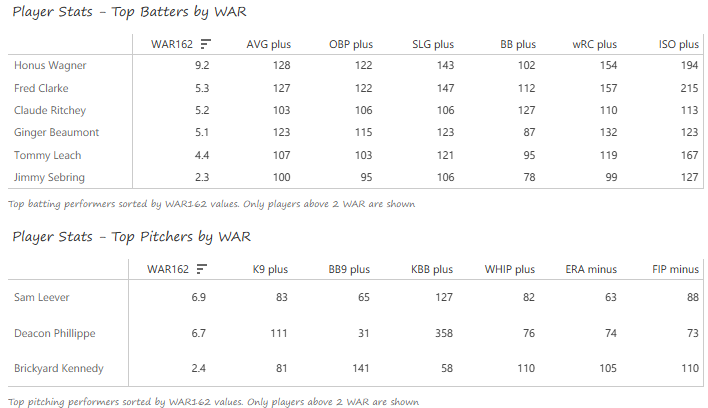
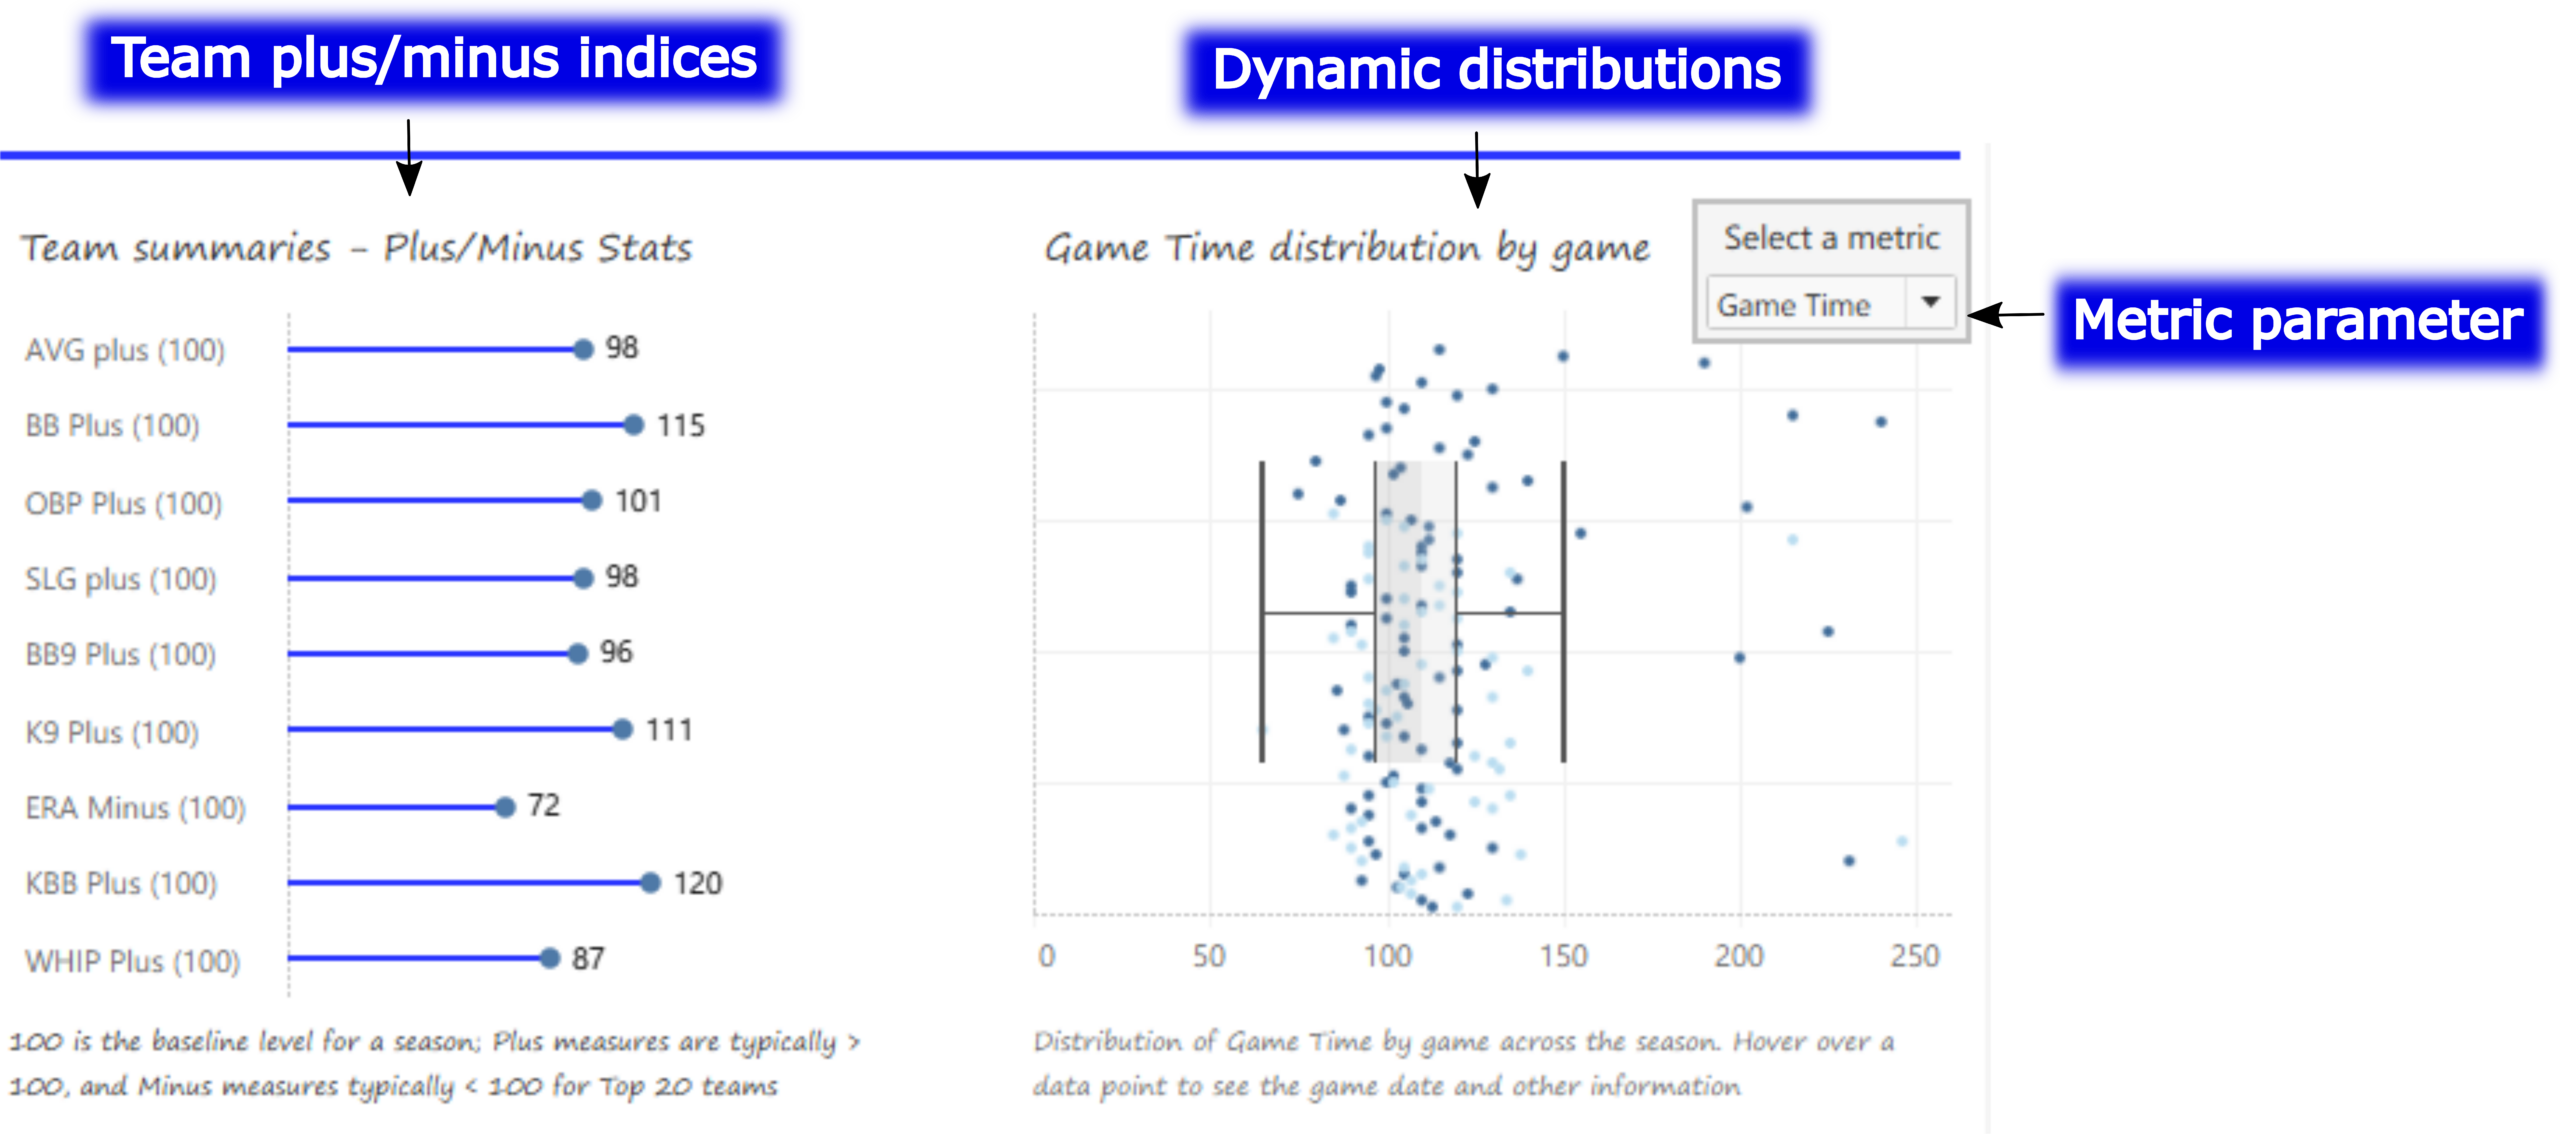
  • By using the dropdown list to update the data in the distribution chart; runs, hits, doubles, and more can be shown at game levels
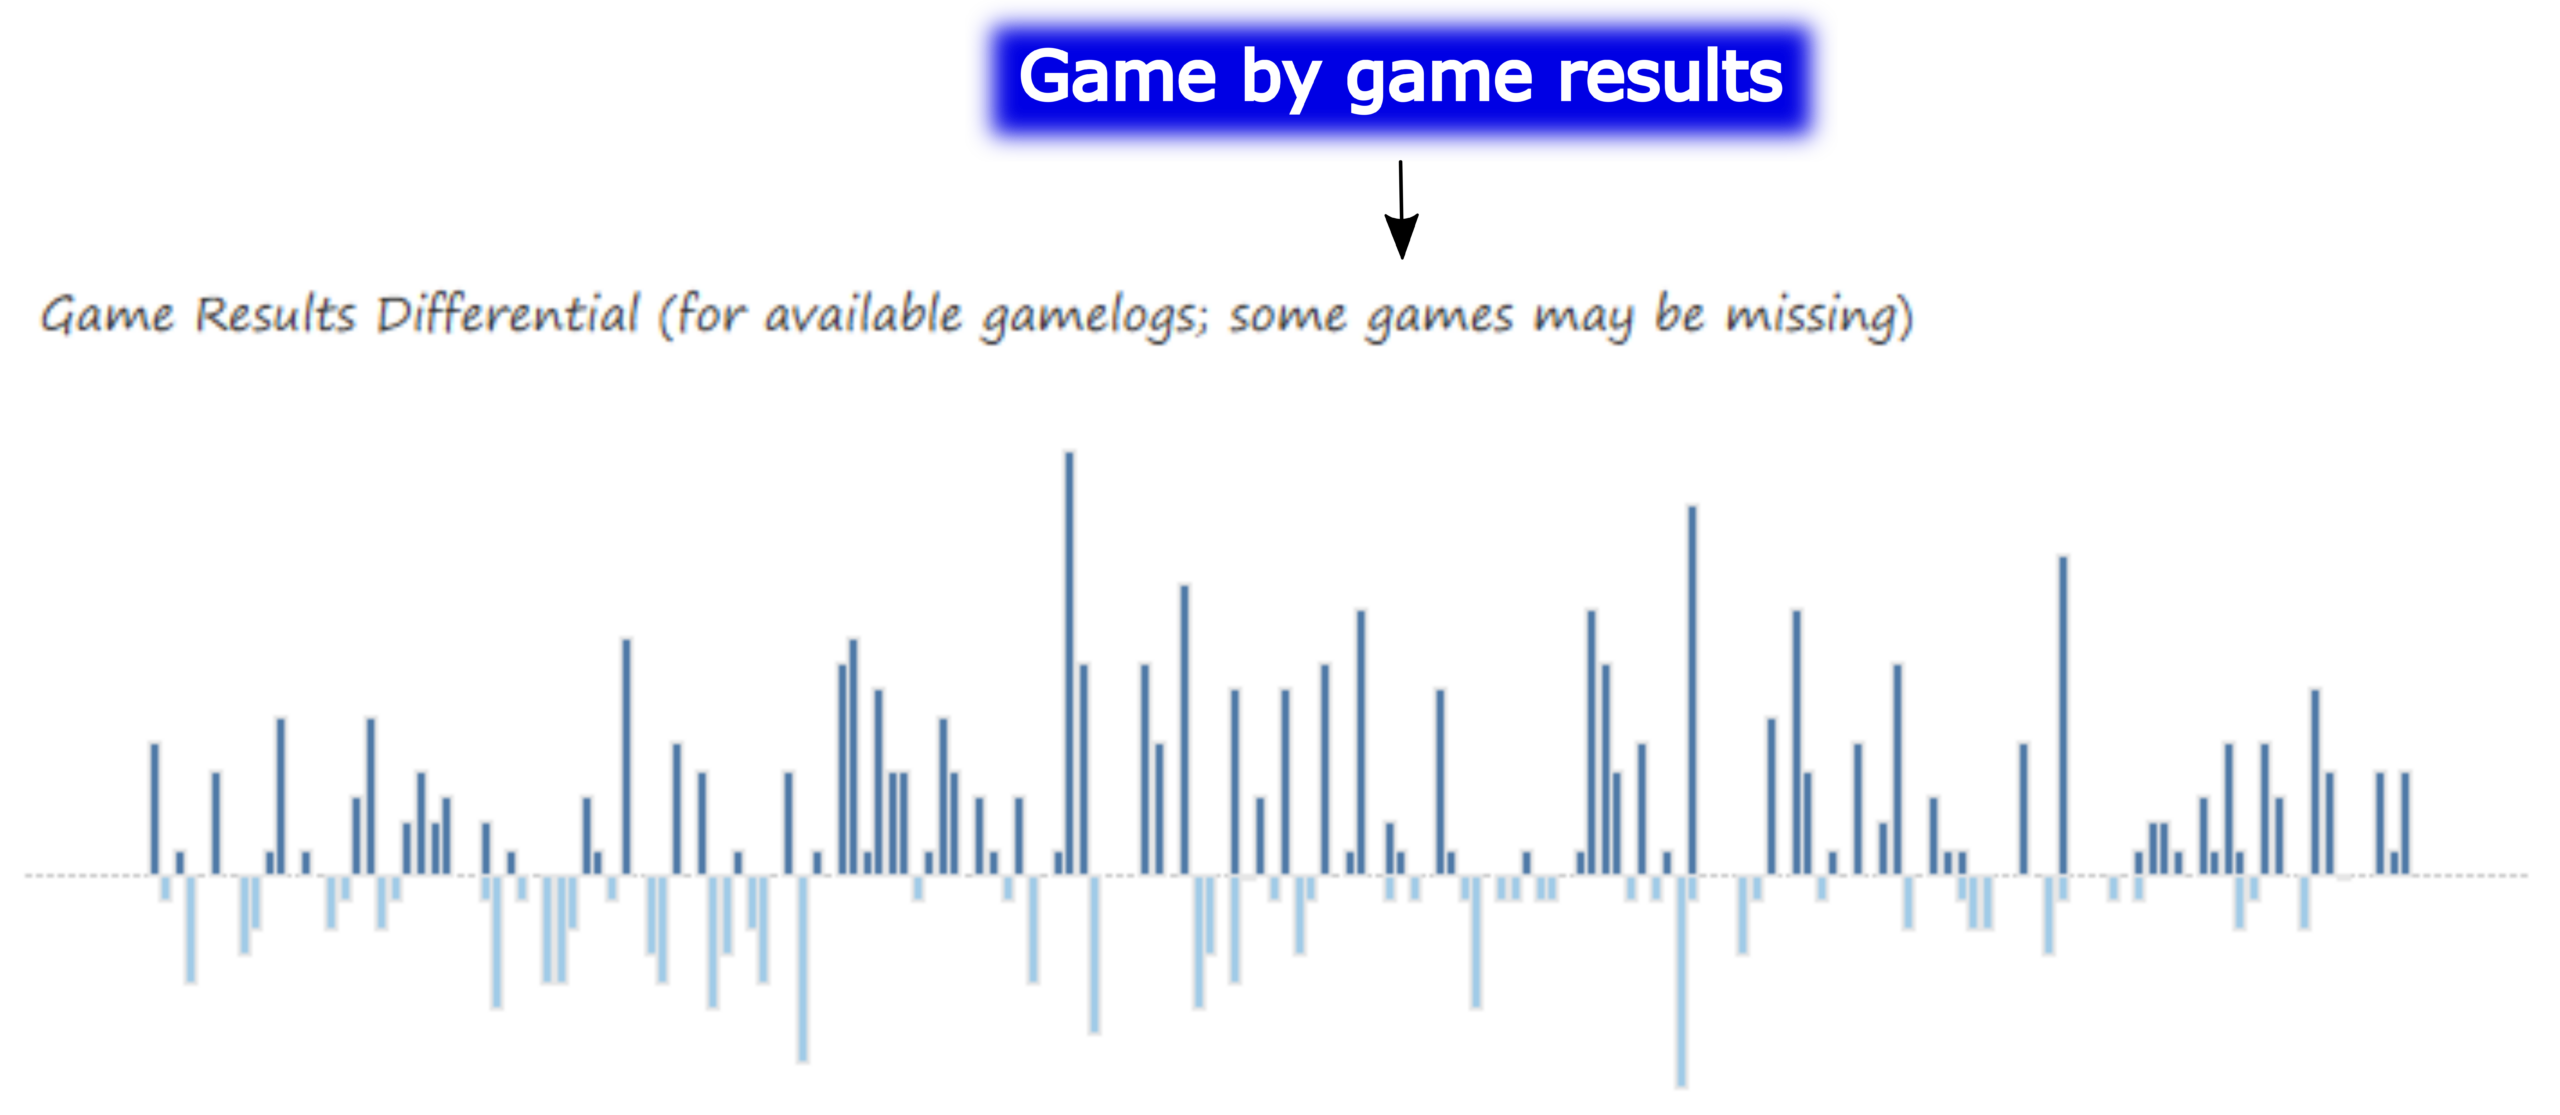
  • By hovering over any display item to reveal more information about that data point

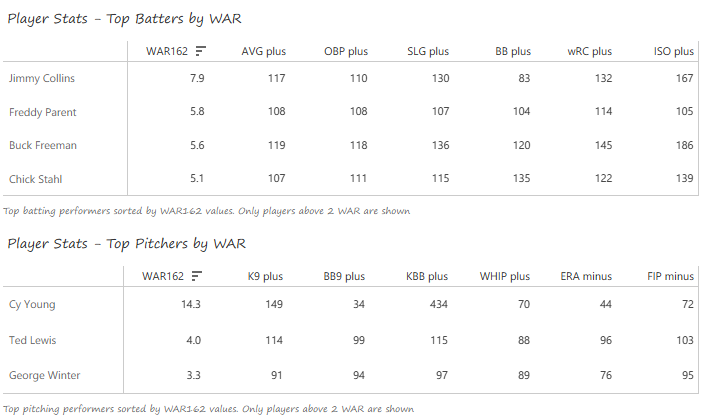
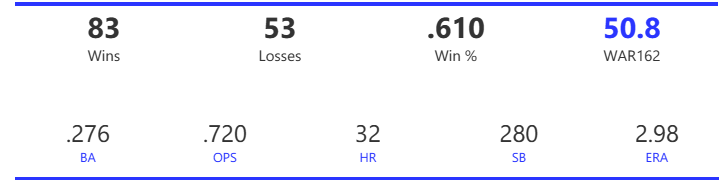
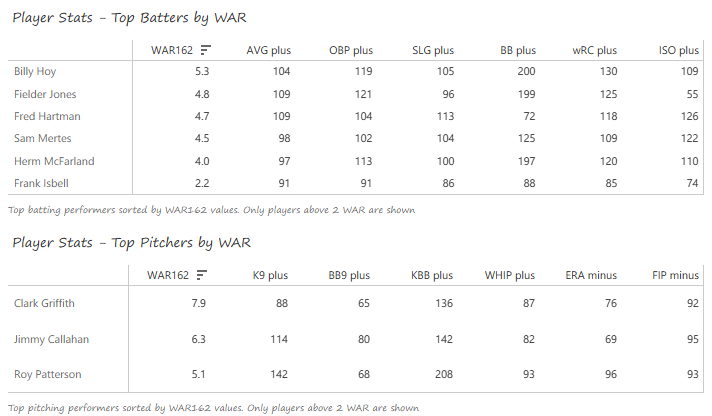
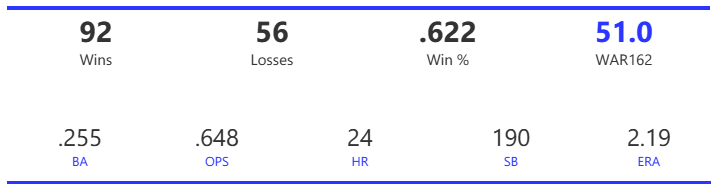
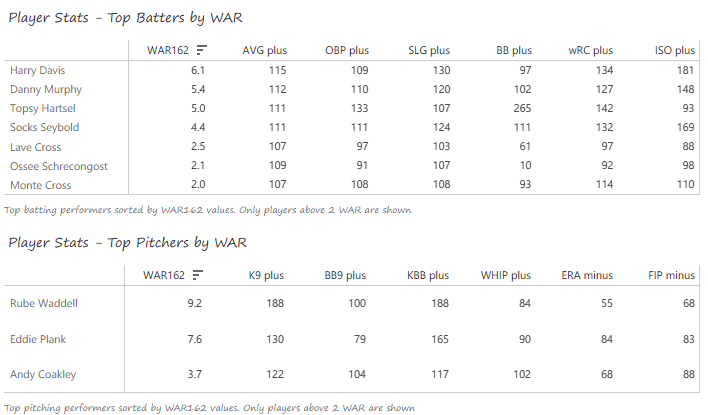
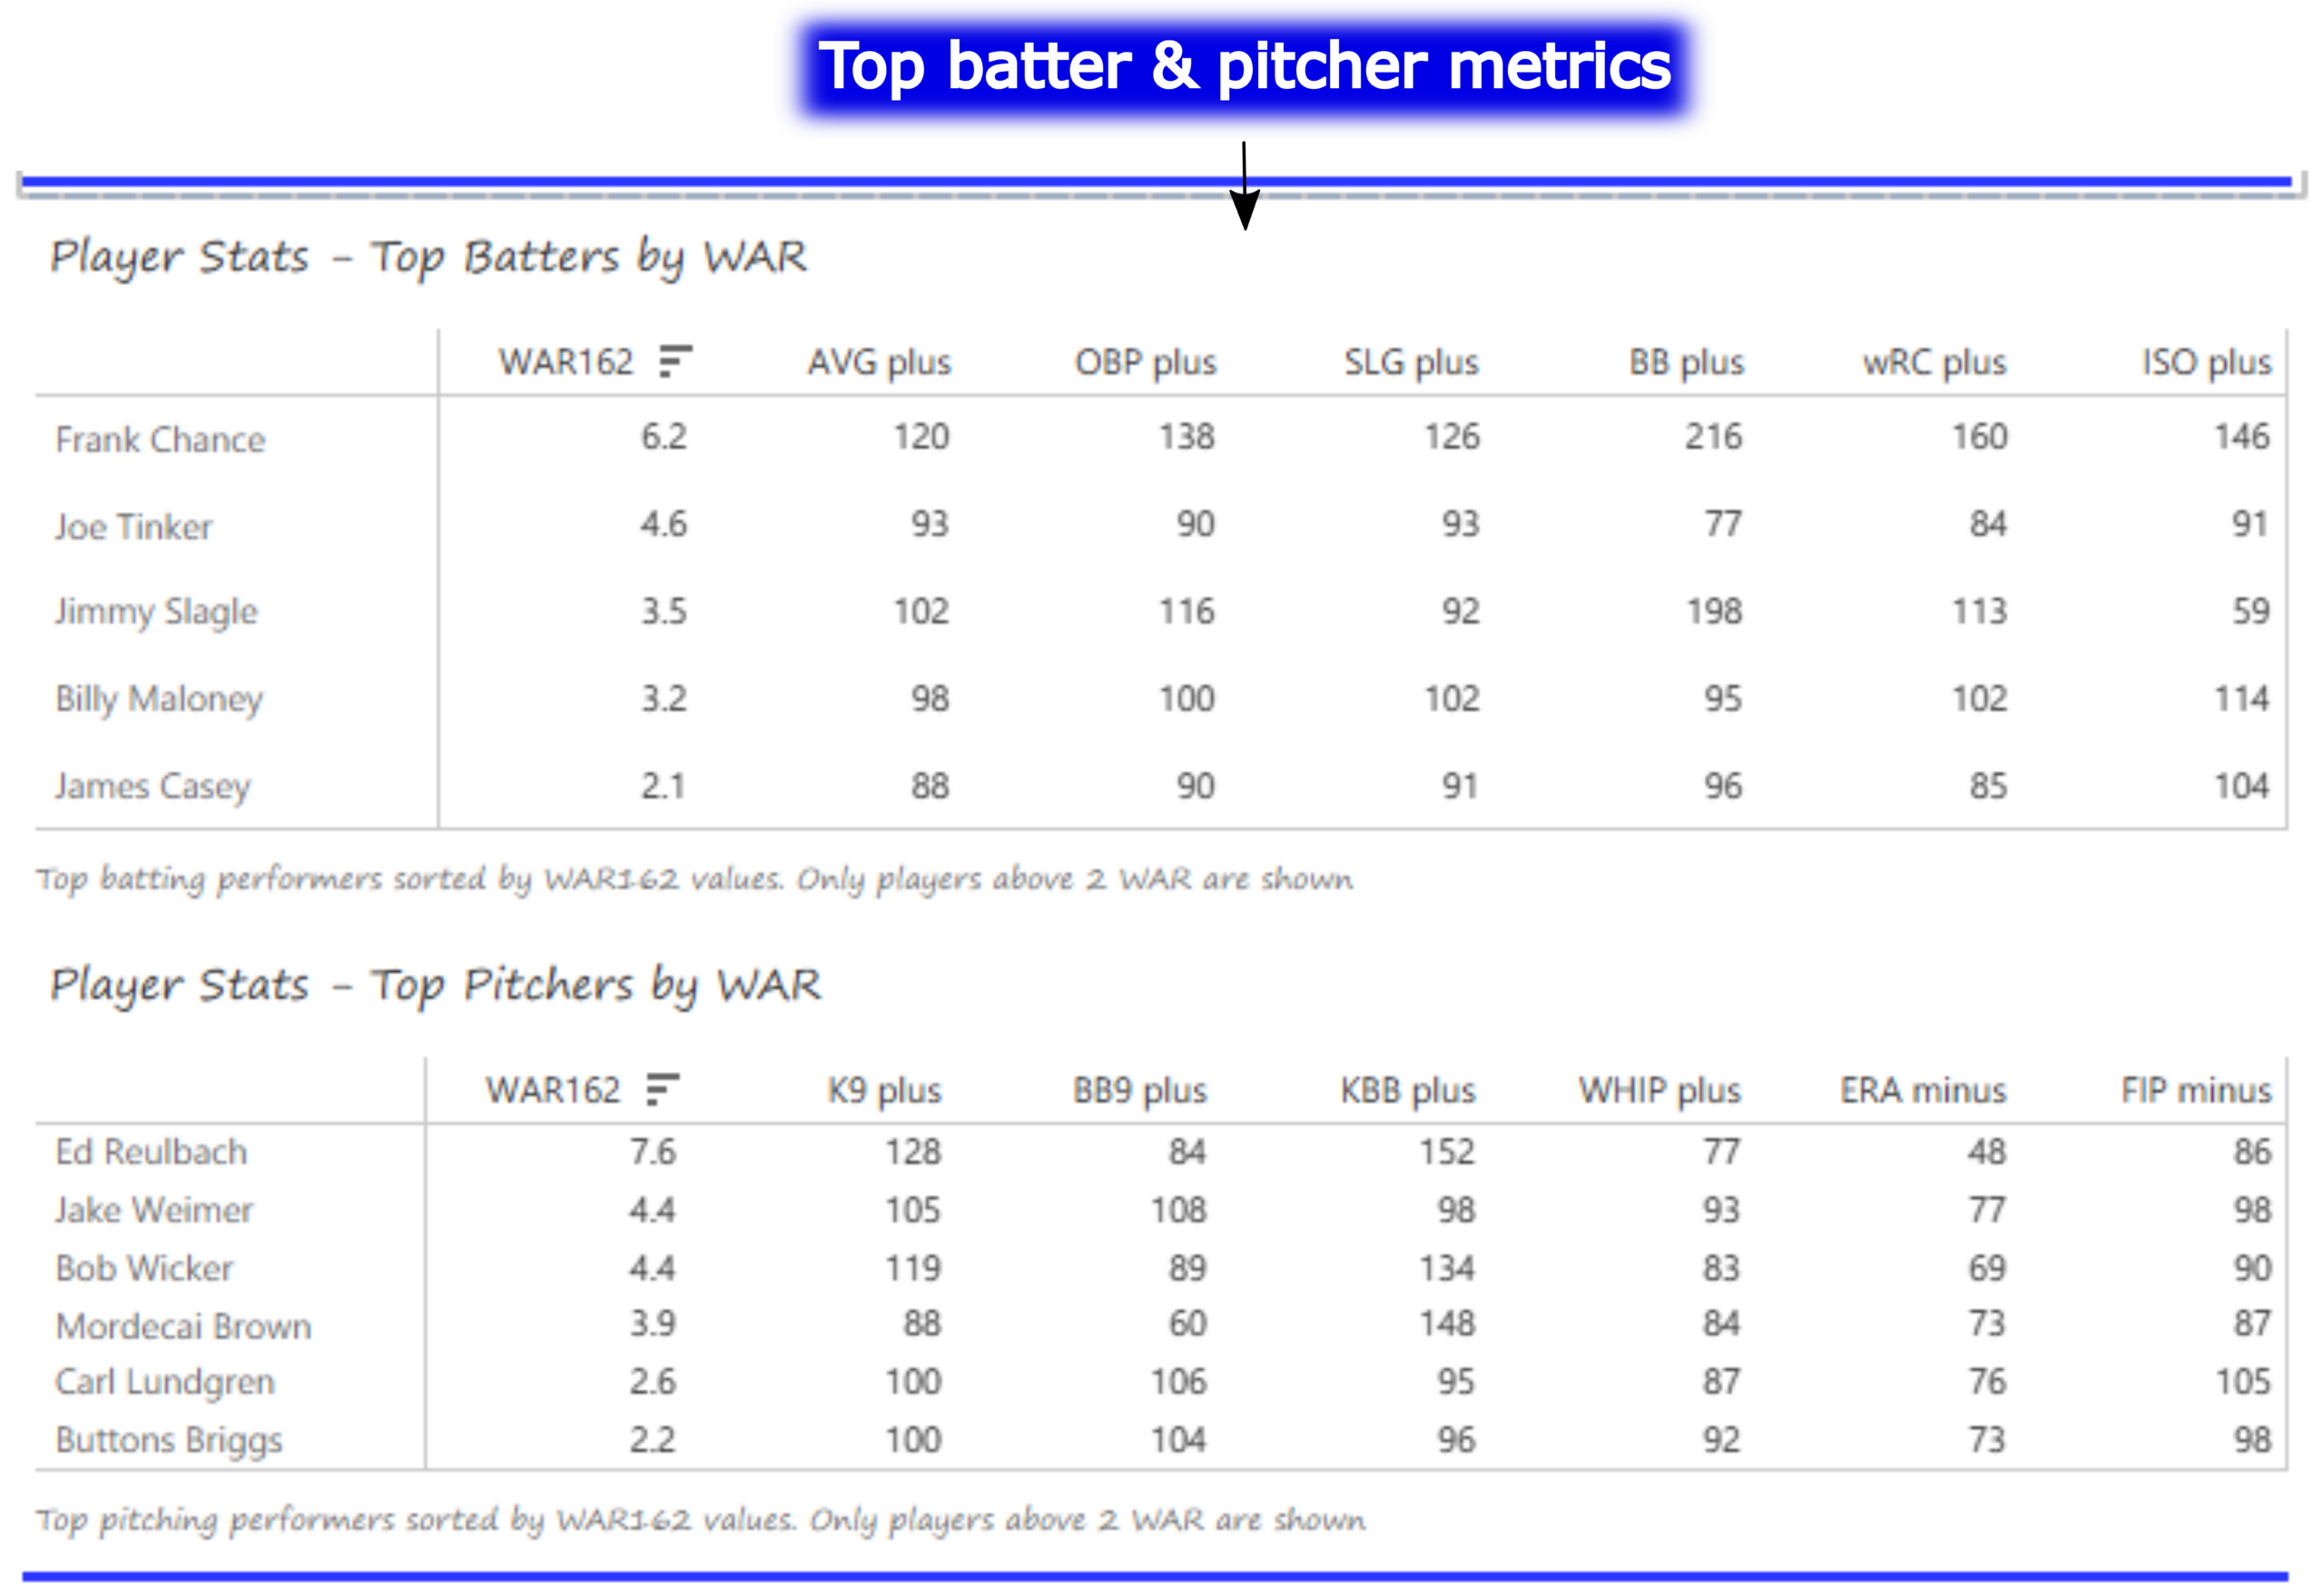
The dashboard provides a fun, easy way to discover new insights about the top teams of the decade (based on the WAR162 metric).

Future dashboards will be rolled out roughly every two weeks; by early August we’ll have every decade through the 2010s covered. Enjoy using the dashboard, and watch for regular countdown updates.

MLB Team Rankings Countdown: 1900s 20 through 16

MLB Team Rankings Countdown: 1900s 20 through 16

Welcome to the first countdown post in our series of MLB team rankings by decade. As a reminder, the teams are ranked from #20 through #1 based on aggregate WAR162. For the 1900s (1901-1909), a total of 144 teams were eligible (16 teams x 9 seasons), so the top 20 teams are a fairly exclusive group. We’ll summarize each team, including portions of their team dashboard, and explain how they attained their ranking. So, without further ado, here are the teams ranked #20 through #16.

Here’s the interactive dashboard at Tableau Public: 1900s Top 20 MLB Teams Dashboard

The Napoleons would eventually become the Naps, then the Indians, and most recently, the Guardians. In 1904, they were named after their star player, Napoleon Lajoie, a Hall of Fame second baseman. Here’s a glance at some of their team numbers:

With a record of 86-65, the Naps managed just a 4th place finish in the American League. The team had an unusually unlucky season – their Pythagorean expected record (based on runs scored vs. allowed) was 95-56, a whopping nine-game difference. Cleveland led the AL in batting average and OPS, and finished 2nd in ERA.

Nap Lajoie led the AL in multiple categories, with a .376 BA, .959 OPS, 102 RBI, and 49 doubles. He received strong support from Elmer Flick (.306 BA, 38 SB) and Bill Bradley (.300 BA). Bill Bernhard won 23 games, and Addie Joss led the AL with a 1.59 ERA within a balanced pitching rotation.

The 1903 edition of the Pirates is one of multiple seasons in the top 20 MLB Team Rankings for the 1900s decade. This version of the team finished first in the NL, but was not quite as good as their record based on runs scored and allowed.

The Pirates’ .286 average was good for 2nd in the NL, as was their .734 OPS, both just behind the Reds. They also placed 2nd in ERA while leading the NL with 16 shutouts.

Honus Wagner was the clear leader in WAR162 on the basis of his league-best .355 BA and 19 triples. His .931 OPS was also near the top of the NL. Wagner received ample support from Fred Clarke (NL-best .946 OPS, .351 BA), Claude Ritchey, Ginger Beaumont (.341 BA), and Tommy Leach. Sam Leever (25-7, NL-best 2.06 ERA) and Deacon Phillippe (25-9, 2.43 ERA, NL-best 1.03 WHIP) dominated on the mound for the NL champs.

The Americans were the predecessor to the Red Sox, finishing 2nd in the AL with a 79-57 record, 3 games worse than their predicted Pythagorean mark of 82-54. This earns them the #18 slot in our 1900s MLB Team Rankings.

The team was just slightly better than league average in most offensive categories, although they did have higher rankings in triples (2nd) and home runs (1st). Pitching carried the team, as they placed 2nd in ERA and 1st in strikeouts, largely thanks to the legendary Cy Young.

Four offensive players carried the load for the Americans, with WAR162 values > 5; no other batters topped 2 WAR for the season. Third baseman Jimmy Collins led the way in WAR (7.9) with a .332 BA, Freddy Parent batted .306 from his shortstop position, Buck Freeman batted .339 with a .920 OPS, and Chick Stahl hit for a .303 average. On the mound, it was Cy Young with some help from Ted Lewis (16 wins) and George Winter (16 wins, 2.80 ERA). Young posted a 33-10 mark with a league-best 1.62 ERA and 0.97 WHIP across 371 innings.

The White Sox claimed first place in the 1901 AL pennant race, 4 games ahead of the Americans, although their WAR totals were nearly identical.

The Chicago squad led the AL in runs scored, stolen bases, and ERA, while ranking in the middle of the pack in BA, HR, and OPS. They also drew a high number of walks; between the walks and stolen bases, the team was able to generate 6 runs per game.

The White Sox had no single offensive standout, but enjoyed productive seasons from several batters, including Billy Hoy, who drew a league-best 86 walks at age 39. Hoy also led the team with an .807 OPS figure. Fielder Jones batted .311 with 38 steals and 84 walks, Fred Hartman hit .309 with 31 steals and 13 triples, and Sam Mertes had 17 triples and 46 stolen bases. Herm McFarland contributed with 75 walks and 33 steals and a .767 OPS. Three pitchers stood out for the Chicagoans, led by Clark Griffith, who compiled a 24-7 record and 2.67 ERA. Jimmy Callahan posted a 15-8 mark, with a 2.42 ERA, and Roy Patterson won 20 games and led the team with 30 complete games and 312 innings on the mound.

The Athletics placed multiple squads in the top 20 for the 1900s decade, with the 1905 edition placing 16th. The A’s bested the White Sox by 2 games for the AL pennant, although the Chicago team had the better Pythagorean win expectation of the two teams.

In a season where pitching dominated, the Athletics’ .255 BA (2nd) and .648 OPS (1st) were at the top, as was their 256 doubles, 45 more than any other competitor. The team’s 2.19 ERA was second-best for the season, and their 895 strikeouts were far ahead of the 652 posted by the Boston Americans.

The Athletics boasted a balanced lineup, with 7 batters earning WAR162 values of 2 or better, including 3 batters who topped 5 WAR apiece. Harry Davis topped the AL with 8 homers, 47 doubles, and 83 RBI to lead the way. Danny Murphy batted .277 from his second base position, and Topsy Hartsel earned a league-best 121 walks and .409 OBP. The pitchers were led by a pair of left-handers; Rube Waddell posted a 27-10 record with an AL-best 1.48 ERA and 287 strikeouts. Eddie Plank earned 24 wins with a 2.26 ERA and 210 strikeouts of his own. Beyond the big two, Andy Coakley picked up 18 wins with a fine 1.84 ERA.

Summary

That’s it for the first entry in our MLB Team Rankings for the 1900s decade! Stay tuned for the countdown from #15 to #11, arriving in a few days. As always, thanks for reading!

The Top 20 MLB Team Dashboard – An Overview

My 2025 book, The Visual Book of WAR, focused on both players and teams with outstanding WAR162 numbers. I’m expanding on that content with MLB team dashboards focused on the top 20 teams by decade. Let’s walk through the completed dashboard format; we’ll take a section-by-section tour and provide a little background for each element in the dashboard. In the following weeks, I’ll be counting down the top 20 teams by decade, starting with the 1900s. In this post, the 1905 Chicago Cubs (ranked #13 for the 1901-1909 period) will be my example.

The MLB Team Dashboard – Team Info and Stats

We’ll start with the top section, which includes the team rank, team name and season, a filter where users enter a rank (from 1 to 20), and some summary statistics capturing key measures such as wins and losses. The rank display and all other information automatically update based on the rank filter. What is the rank based on, you may ask? We are using WAR162, shown in blue in the top section; this measure is an aggregate value based on the sum of individual player WAR values for the season.

MLB team dashboard – Top section with summary team info

The MLB Team Dashboard – Plus/Minus and Distribution Charts

Moving down the page, we now see some interesting charts; a series of team-level plus/minus indices is shown on the left, while a dynamic distribution chart (with box plot) can display anything from runs to hits, to attendance and game time (in minutes). The metric parameter allows users to update the adjacent chart quickly and easily. Hovering over any data point in either chart provides further detail on the respective measure.

MLB team dashboard – Team indices and dynamic distribution chart

The MLB Team Dashboard – Game-by-Game Results Chart

The next chart displays game-by-game results (where available), showing the run differential for a win (above the zero axis) or loss (below the axis). Selecting a single game bar tells us the date, teams, and score for that specific game. The taller the bar, the greater the run differential; in other words, tall bars are an indication of a one-sided game, win or lose.

MLB team dashboard – Game-by-game run differentials

Batter and Pitcher Performance

Our final section features the top-performing batters and pitchers (ranked by WAR162), along with a handful of indexed measures that provide insight into their performance relative to league averages (always set to 100). Hovering over any value provides a summary of the player and his indexed value for that metric. In this section we can see the top players for the 1905 Cubs – Frank Chance, Joe Tinker, and especially Ed Reulbach.

MLB team dashboard – Indexed measure and WAR162 for top performers

I’ll be sharing the live link to the Tableau Public dashboard shortly, as I begin the countdown posts next week. I’m excited to premiere the dashboard and start the countdowns. As always, thanks for reading!