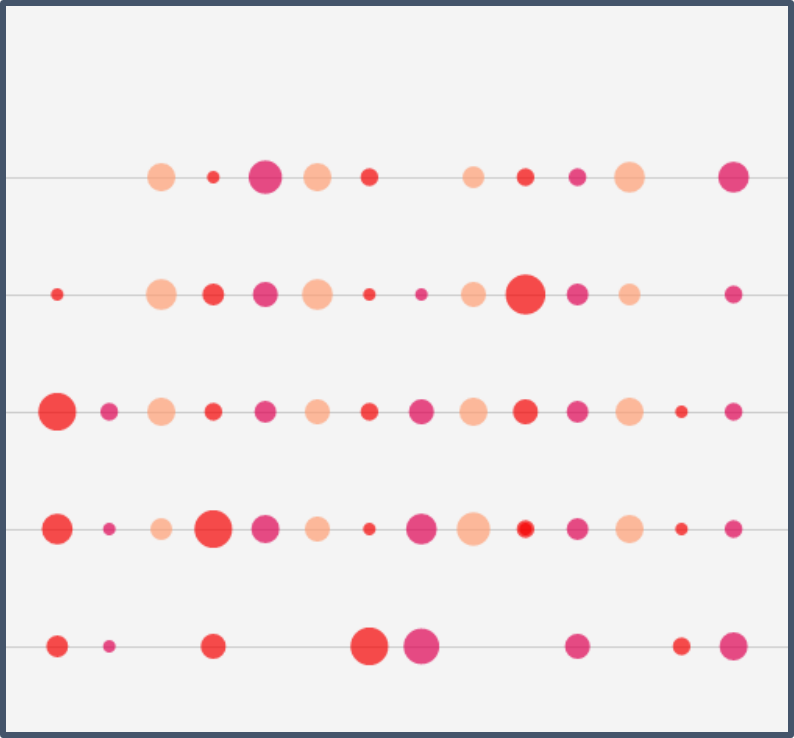
Circle Plots use the size of a circle (bubble) to display the frequency of an event, such as how often a team finished in fourth place over a selected period. They allow viewers to quickly discern general patterns. These plots were created using D3.
Circle Plots use the size of a circle (bubble) to display the frequency of an event, such as how often a team finished in fourth place over a selected period. They allow viewers to quickly discern general patterns. These plots were created using D3.