Welcome to the final countdown post in our series of MLB team rankings for the 1990s. As a reminder, the teams are ranked from #20 through #1 based on aggregate WAR162. For the 1990s (1990-1999), a total of 278 team-seasons were eligible, so the top 20 teams are a rather exclusive group – the top 7% for the decade. The 90s were a challenge, with two short seasons due to contract issues. The 1994 season fell well short of the 162-game schedule, with most clubs playing just 115 games. In 1995, most teams played about 140 games. I’ve elected to include both seasons, given that WAR162 adjusts for the number of games played. We’ll summarize each team, including those from 1994-95, and include portions of their team dashboard. Then we’ll explain how they attained their ranking. So, without further ado, here are the teams ranked #5 through #1.
Here’s the interactive dashboard at Tableau Public: 1990s Top 20 MLB Teams Dashboard
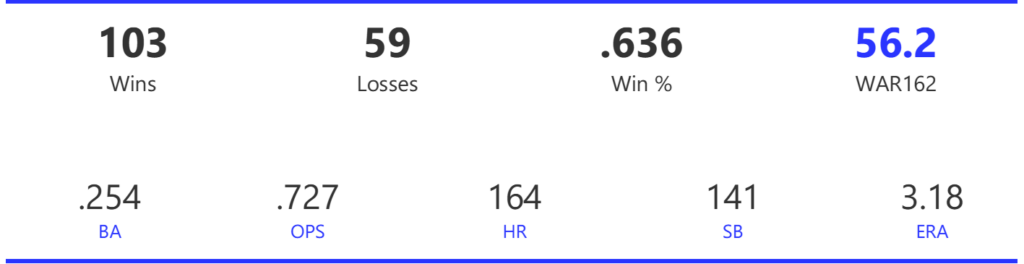
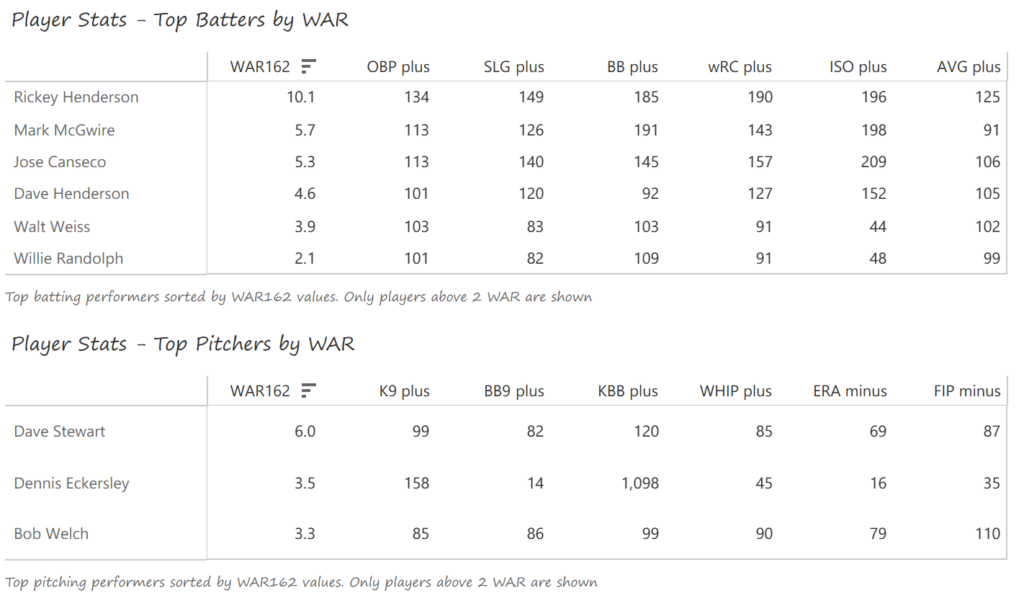
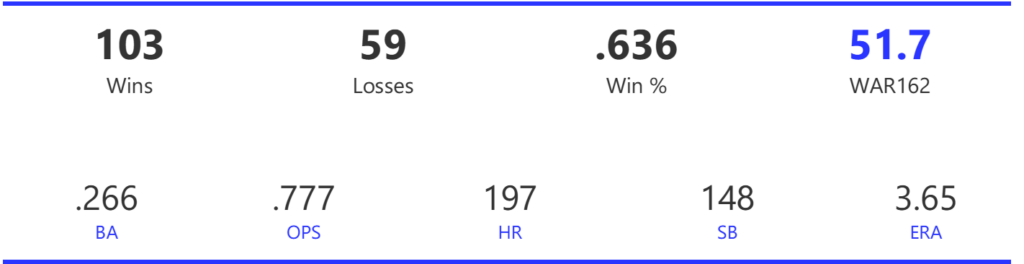
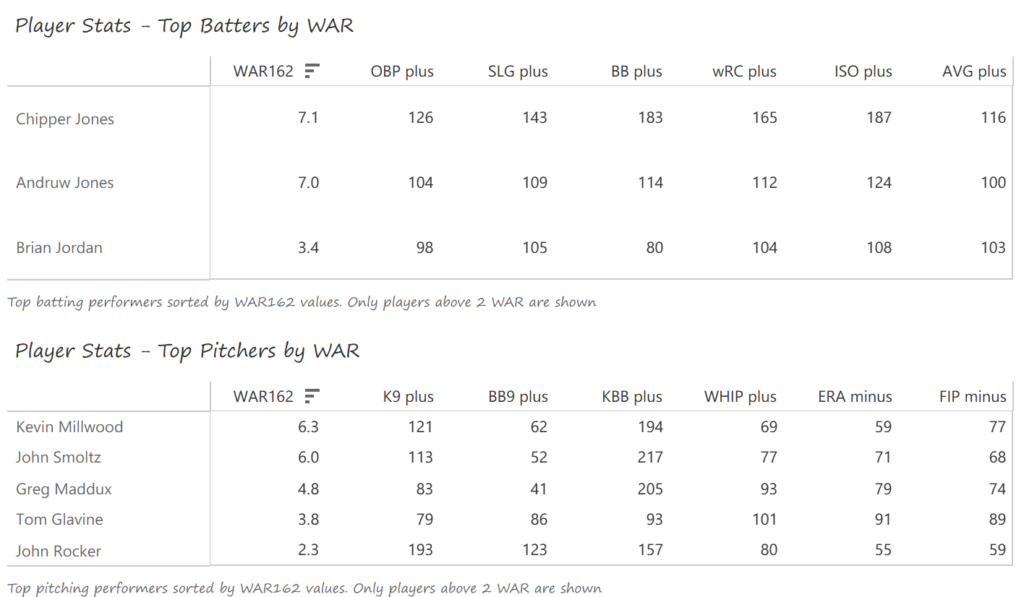
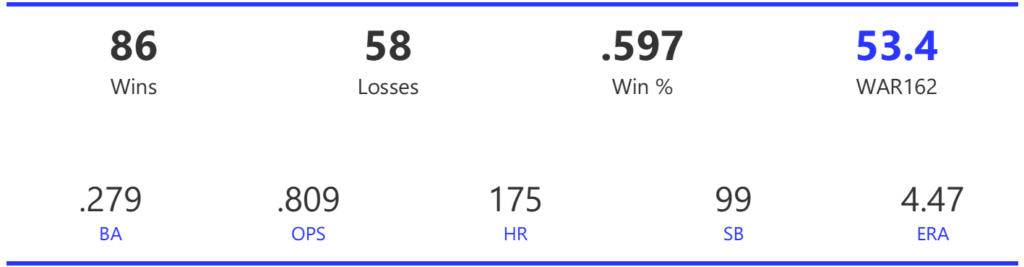
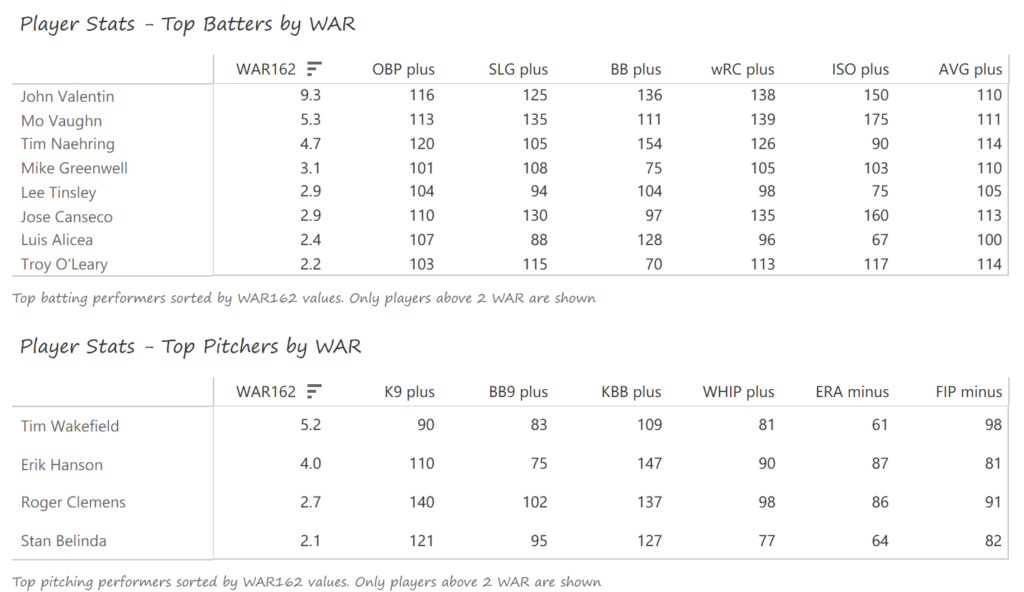
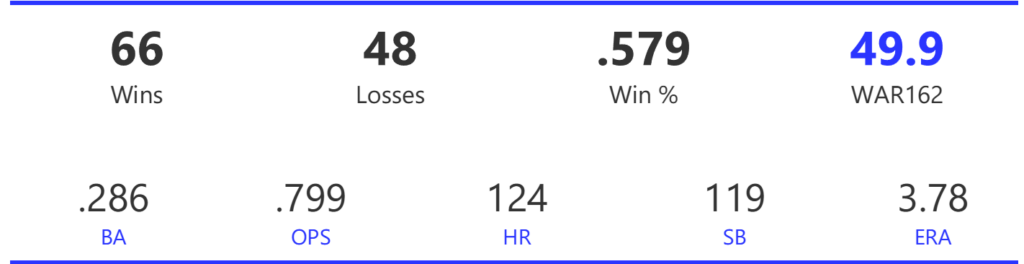
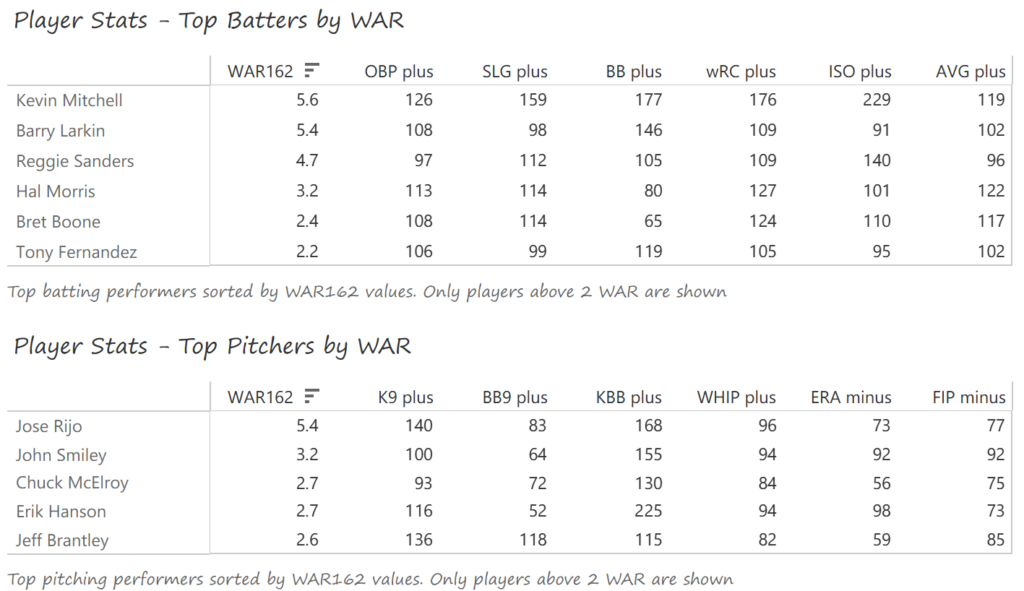
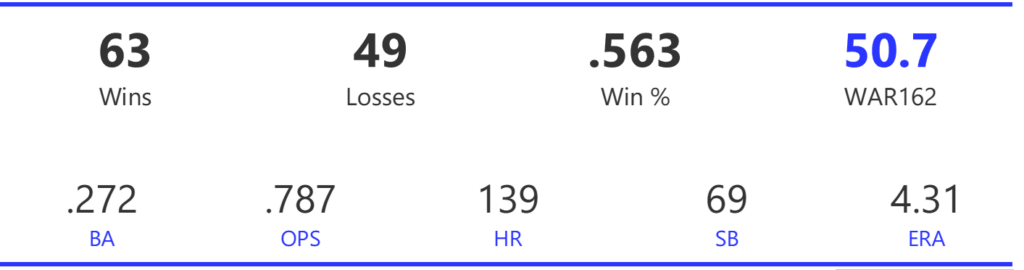
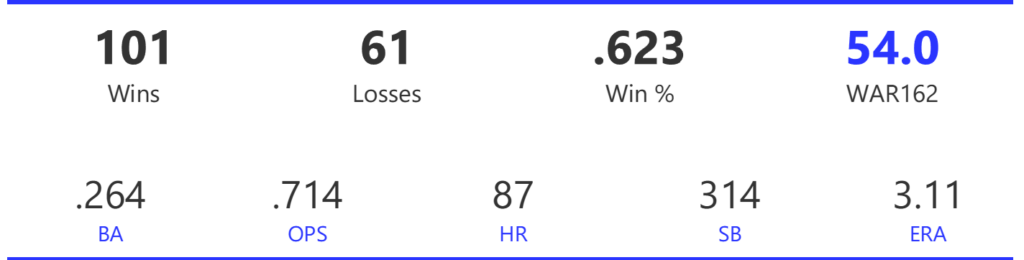
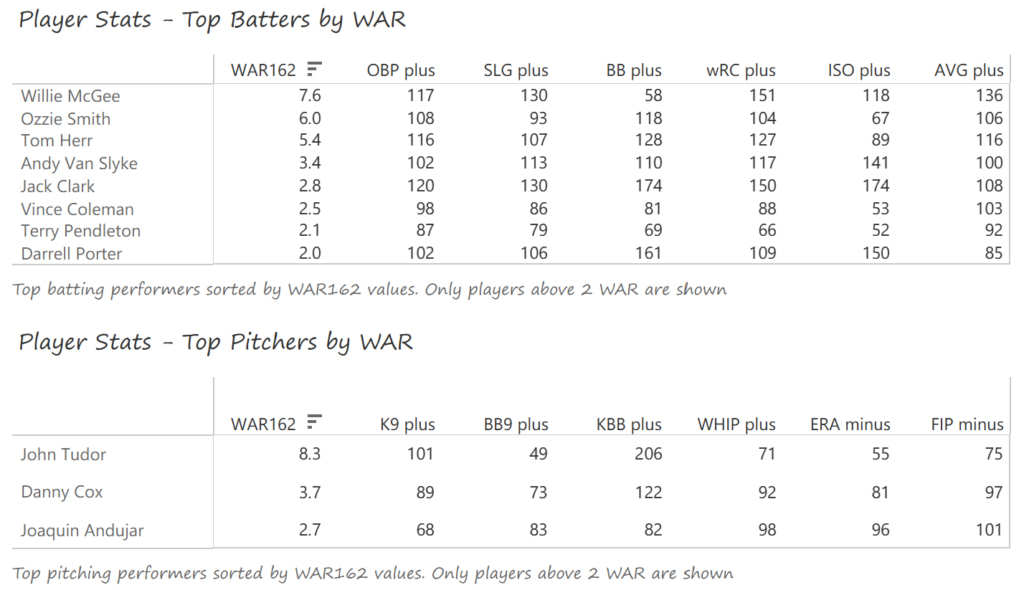
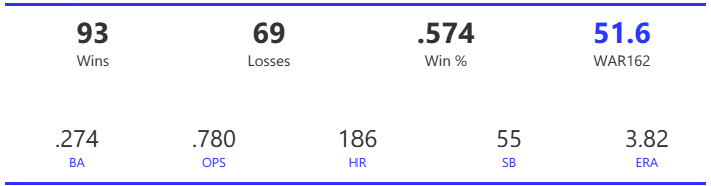
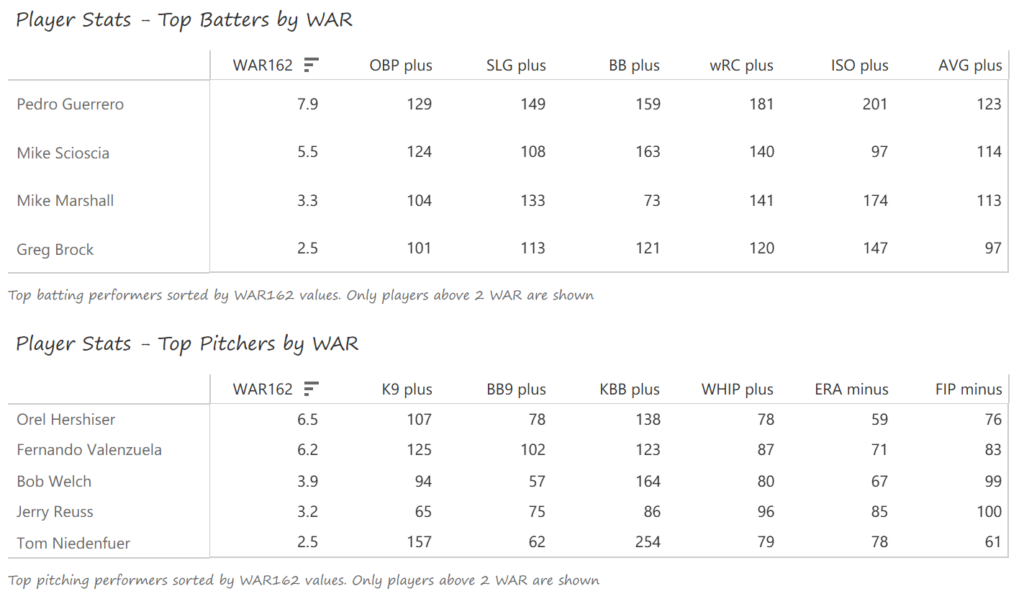
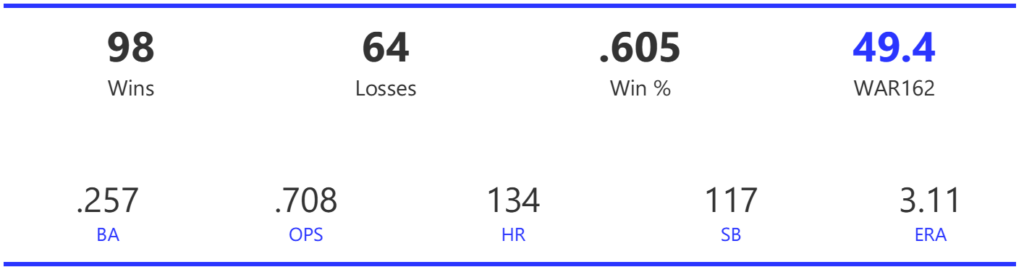
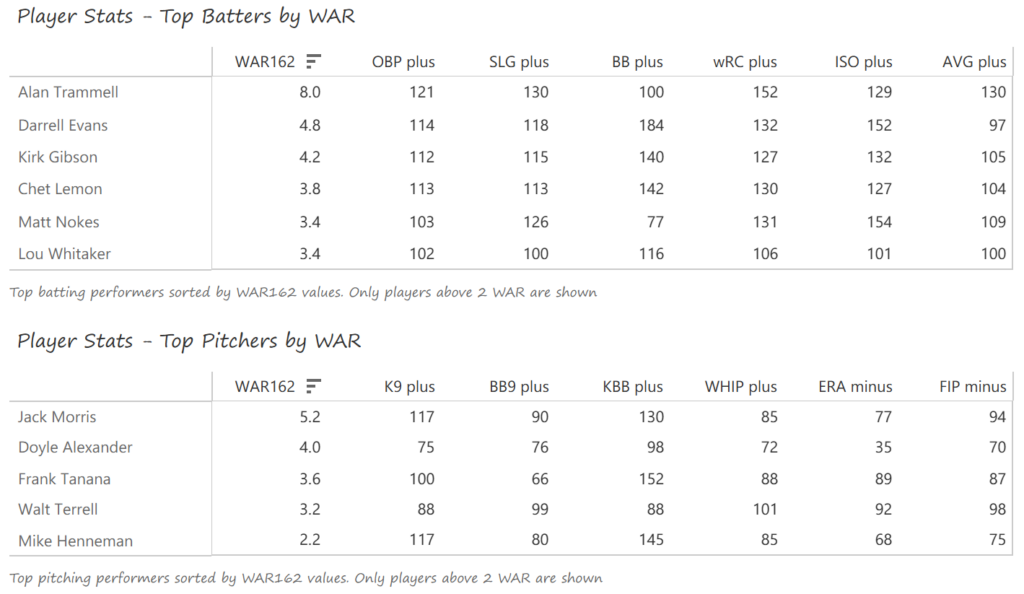
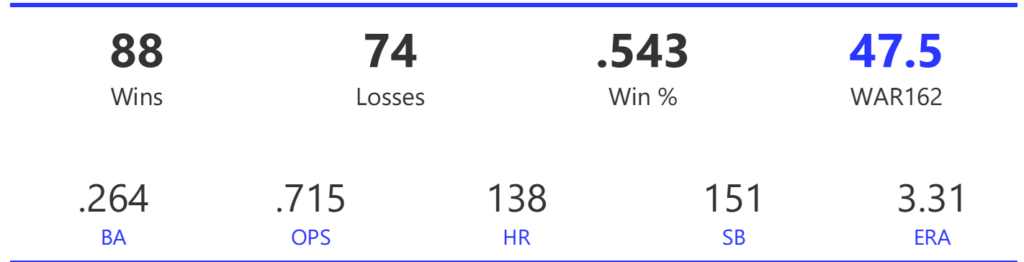
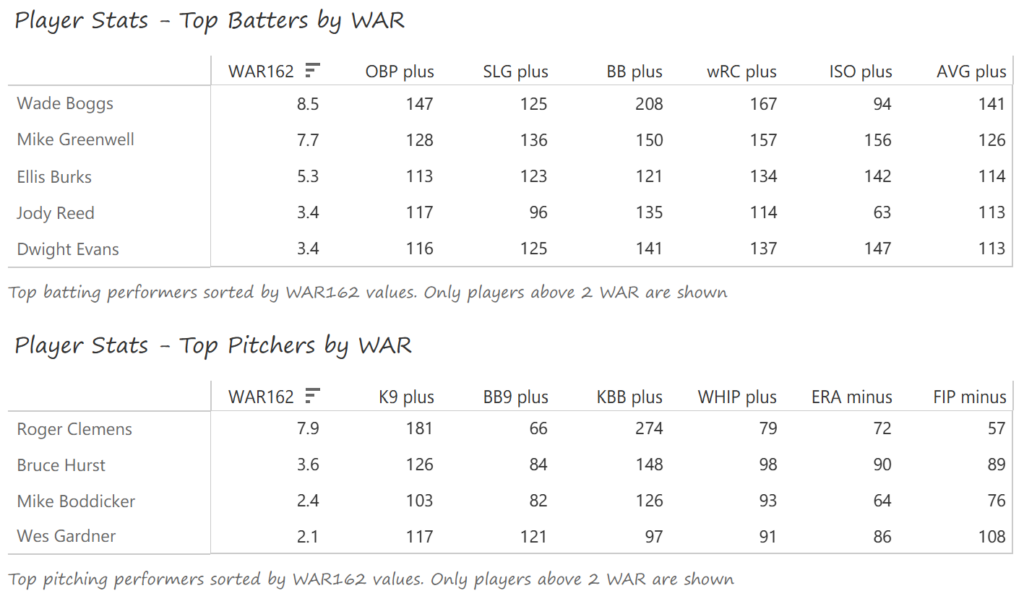
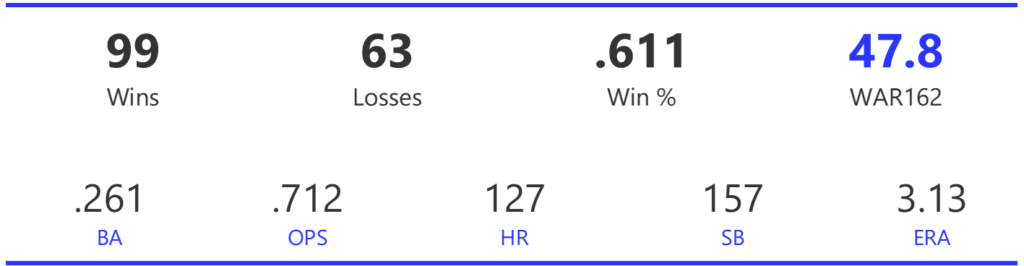
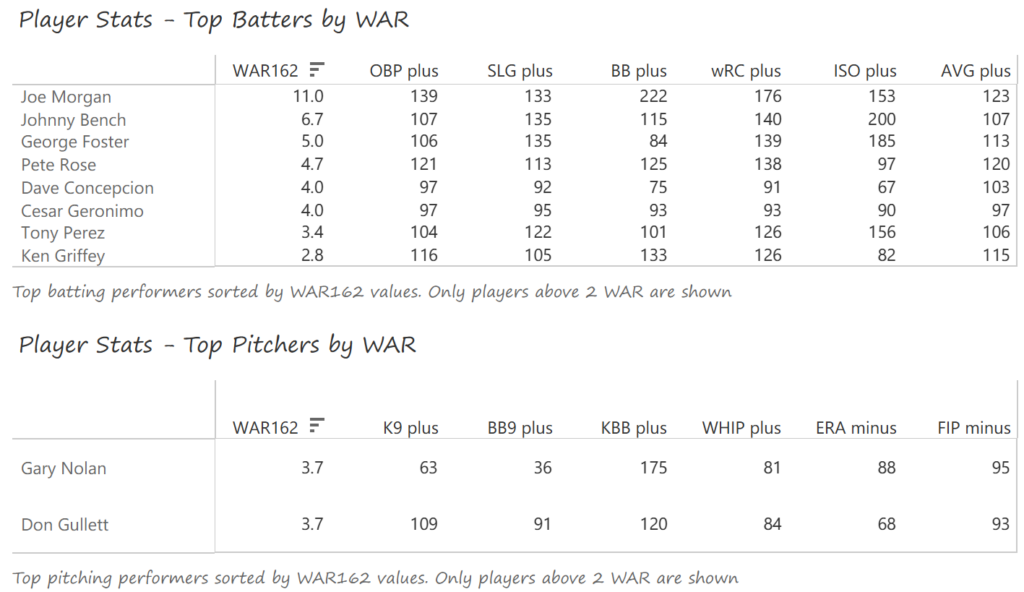
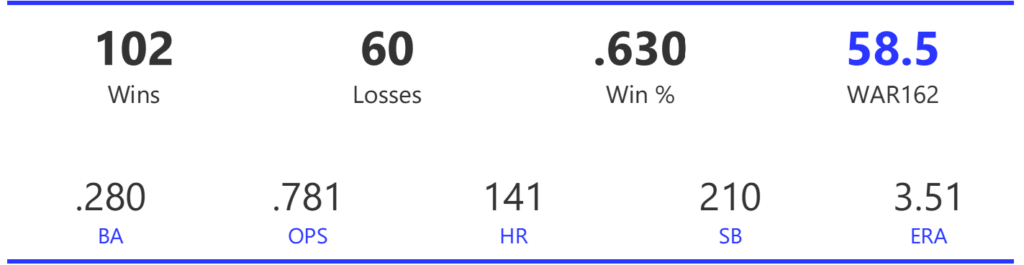
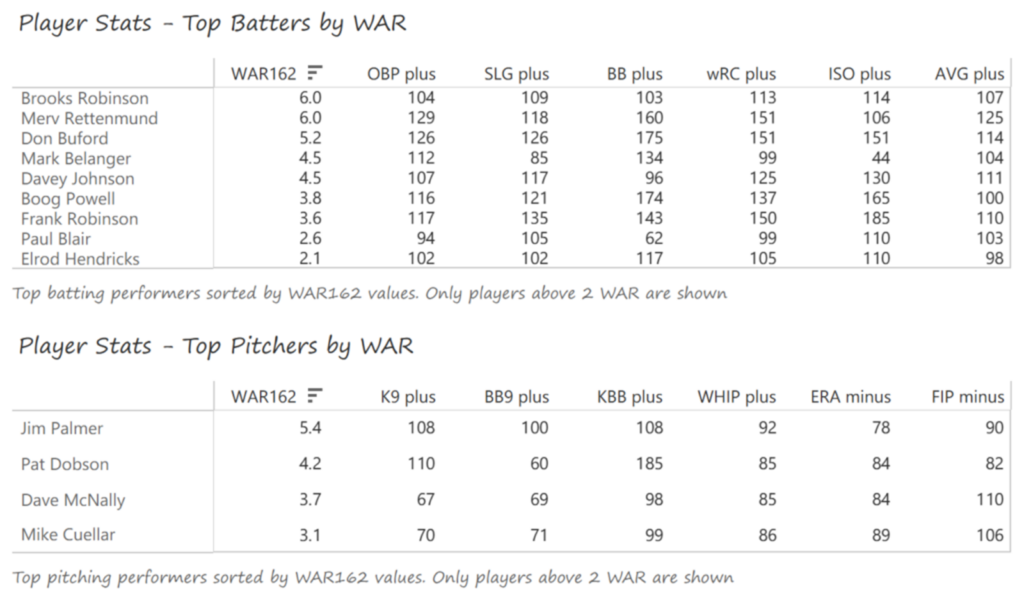
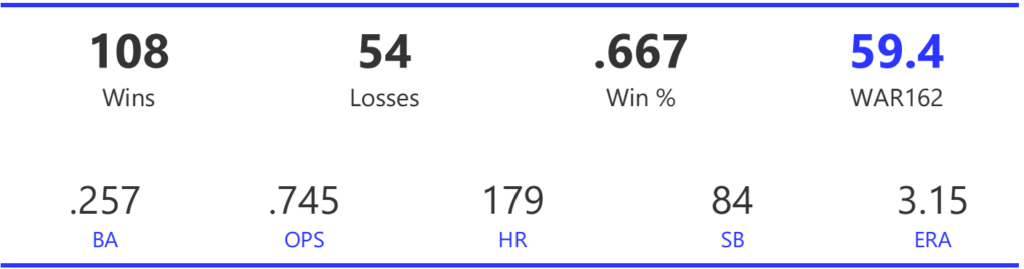
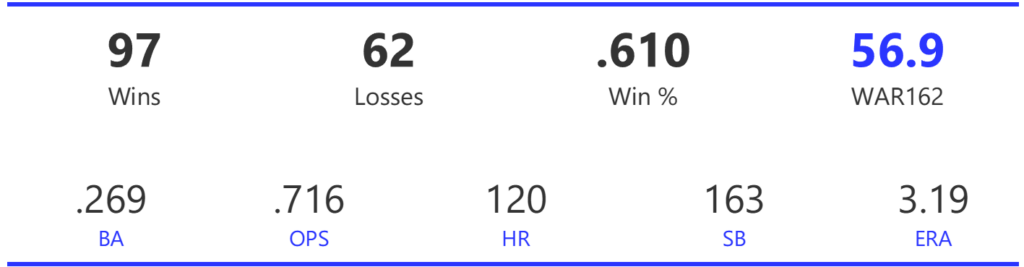
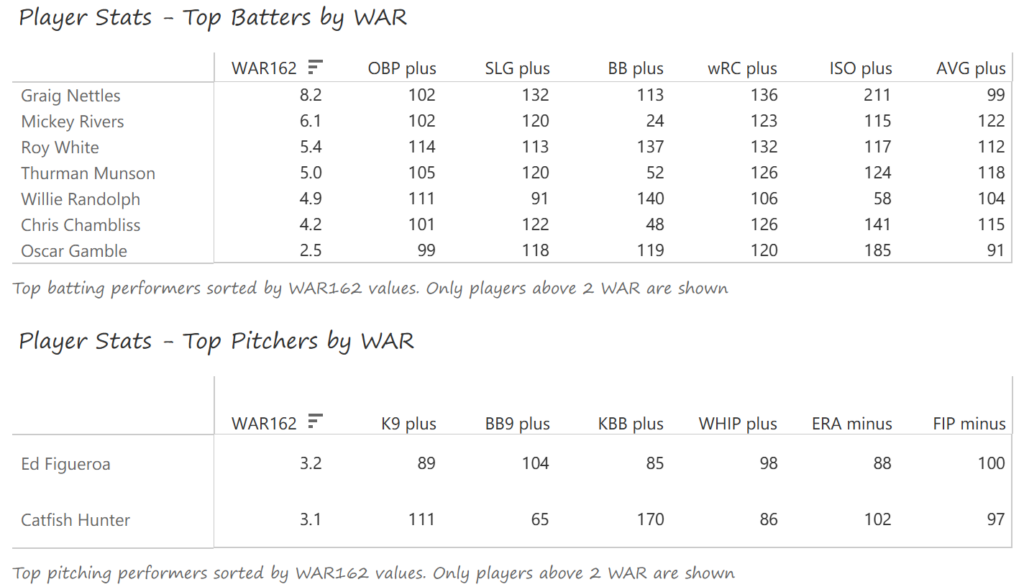
#5: 1993 Atlanta Braves, 57.8 WAR162
The 1993 Braves nipped the Giants by a single game to claim the NL West, before being defeated in a six-game ALCS by the Phillies. Nevertheless, 1993 provided a glimpse of further dominance to come from the Atlanta club.
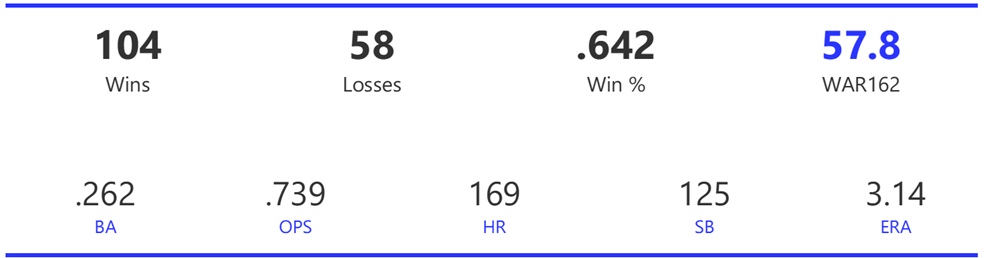
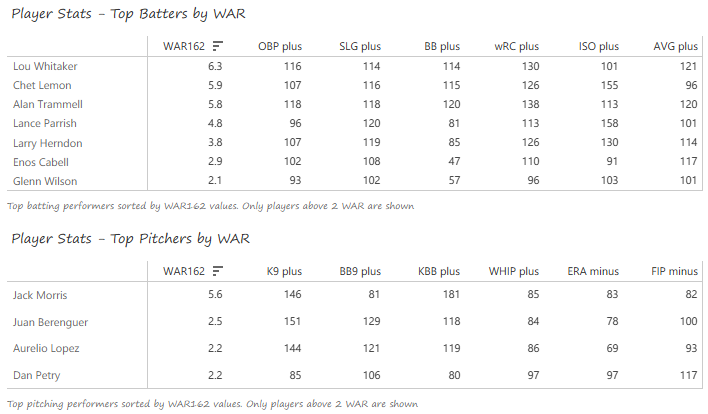
The Braves had a solid if unspectacular offense in 1993, leading the NL in home runs, but placing further down the list in other major categories. They ranked third in runs, ninth in BA, fourth in OBP, fifth in OPS, and sixth in steals. Pitching was the Braves real strength, as the team ranked first in ERA and WHIP by large margins over their rivals. They also placed third in strikeouts and strikeout-to-walk rate in the 14-team National League.
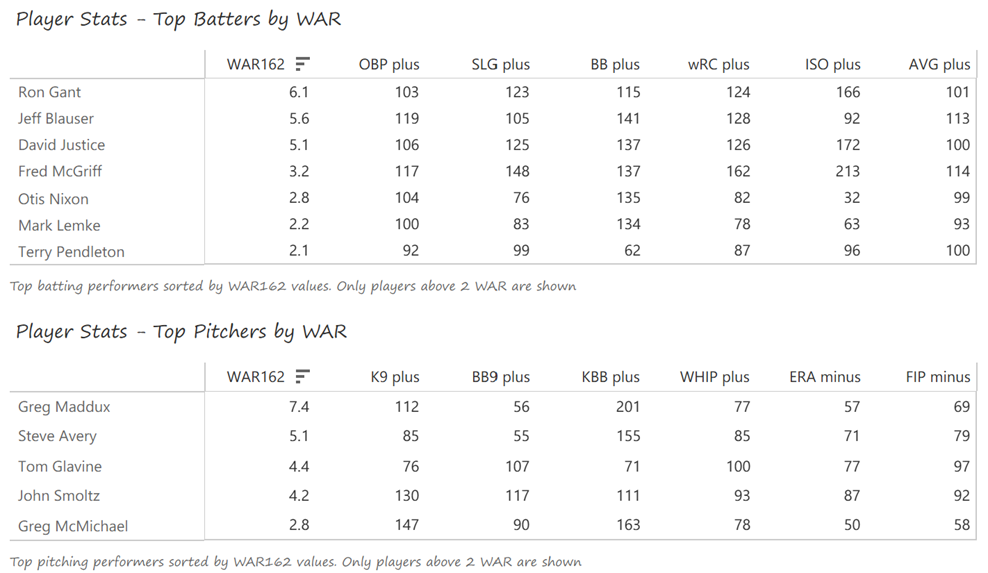
Ron Gant had a big year at the plate, swatting 36 homers with 117 RBI and 113 runs scored. Gant also swiped 26 bases on the season. Jeff Blauser batted .305 with a .401 OBP and 110 runs scored, followed by David Justice with 40 homers and 120 RBI. Other contributors included Fred McGriff (19 homers in 68 games) and Otis Nixon (47 steals). Greg Maddux topped a formidable rotation with a 20-10 mark. Maddux led the NL in ERA, WHIP, and complete games on his way to the Cy Young Award. Steve Avery went 18-6 with a 2.94 ERA, and Tom Glavine recorded a 22-6 mark. John Smoltz added another 15 wins.
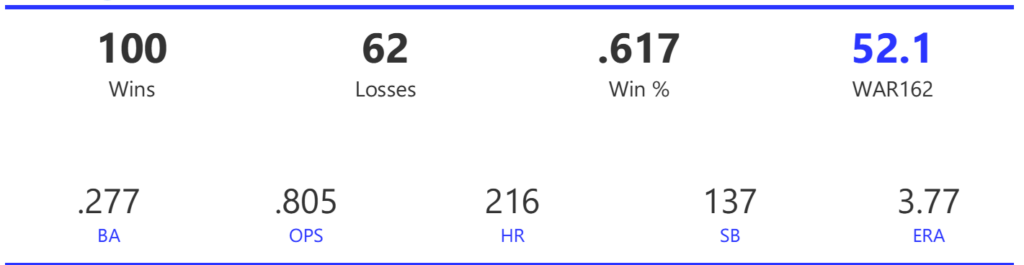
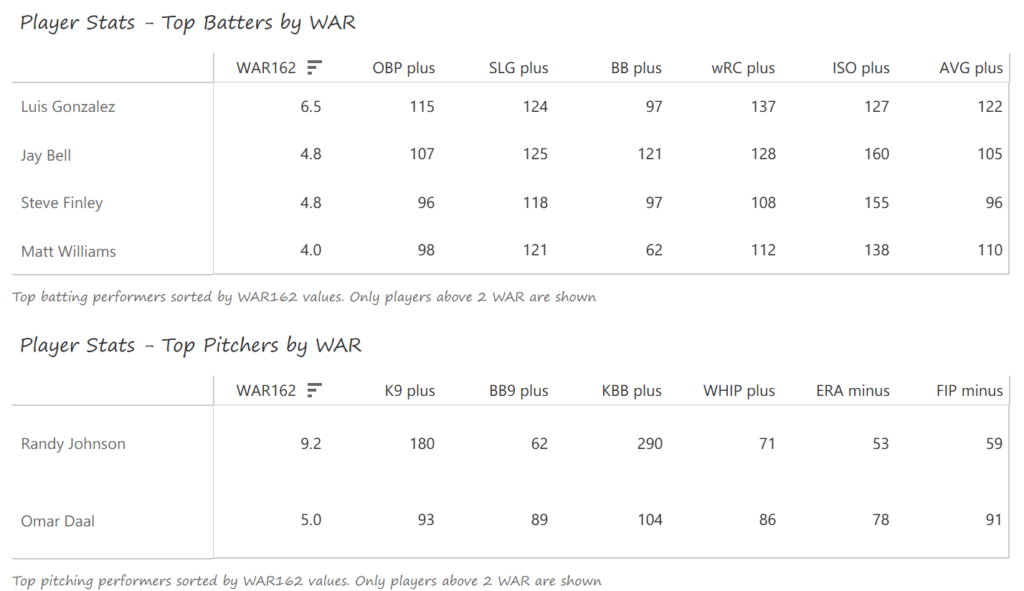
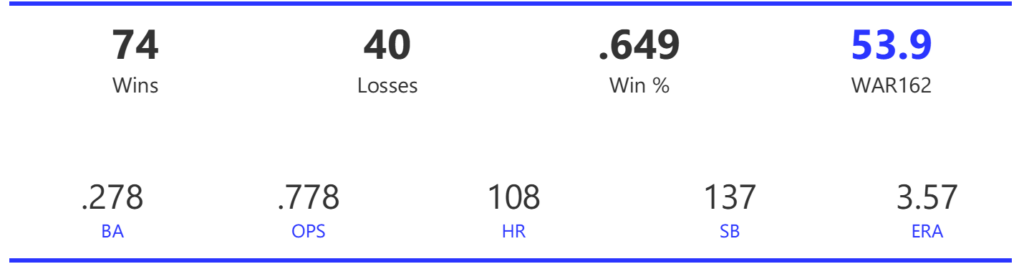
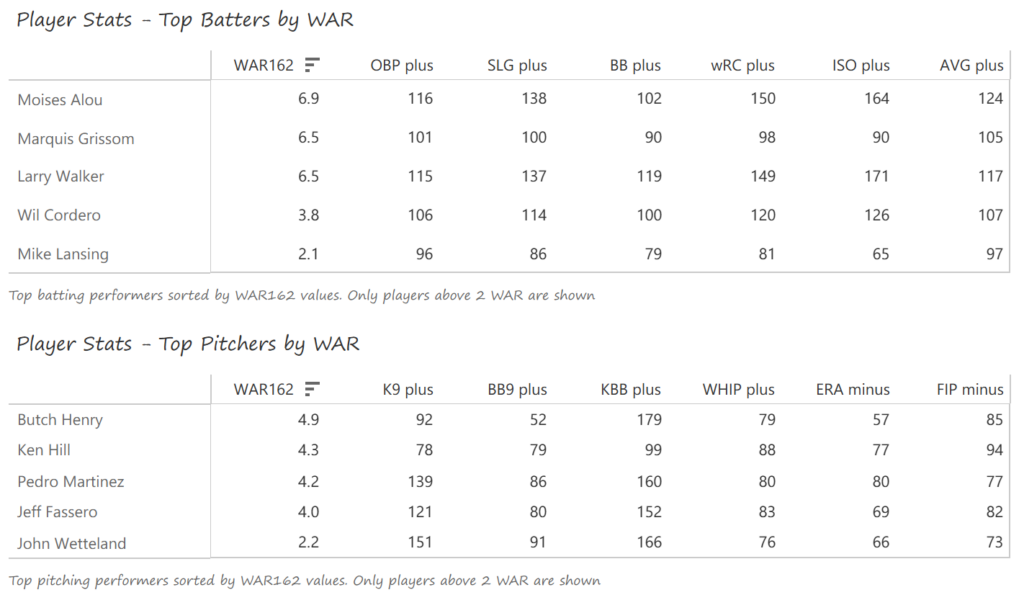
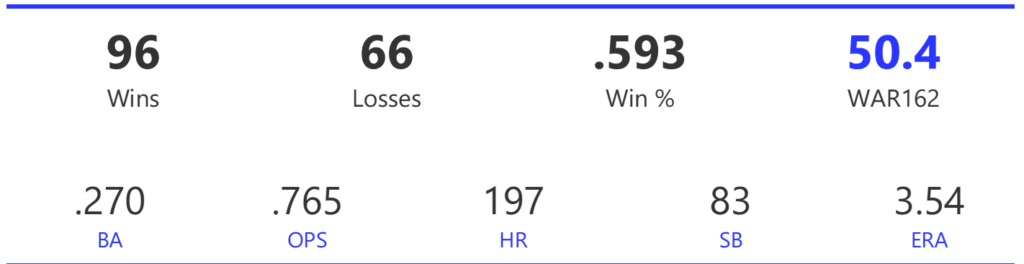
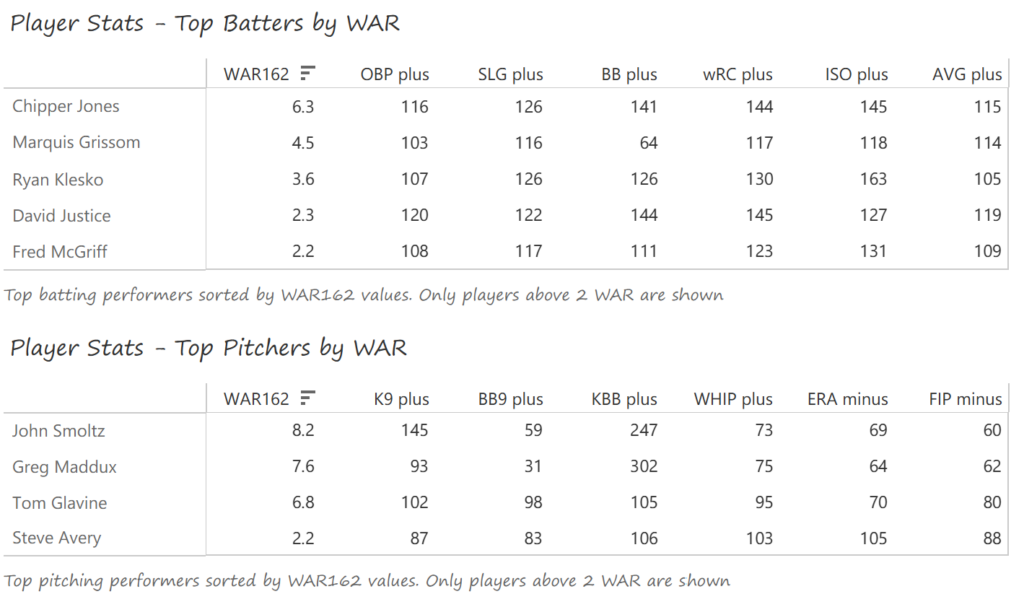
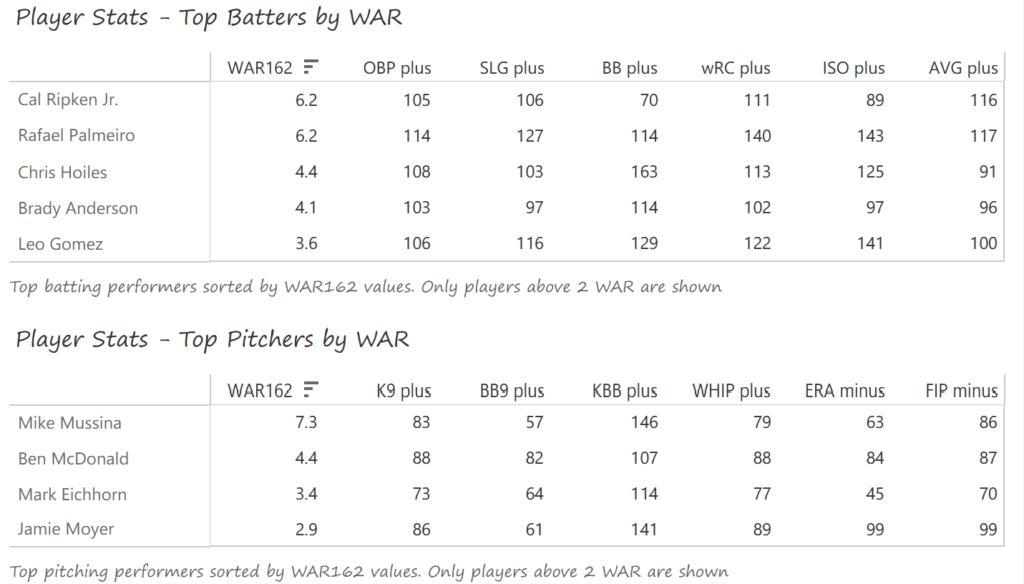
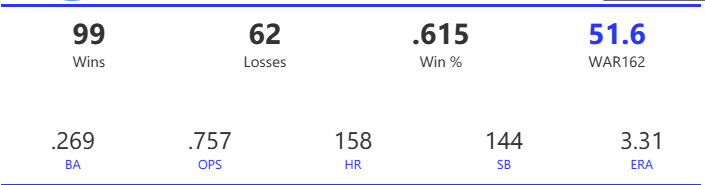
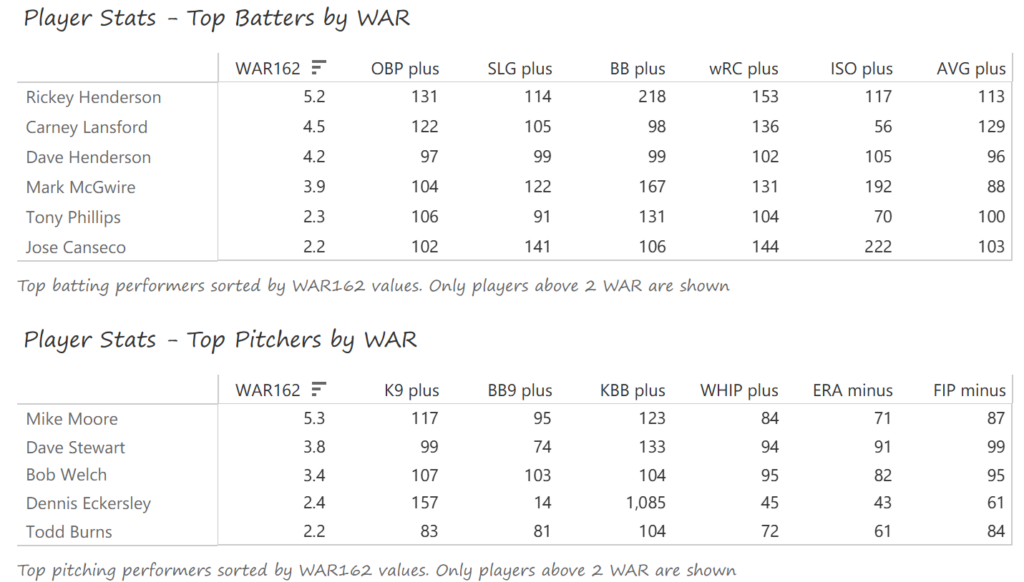
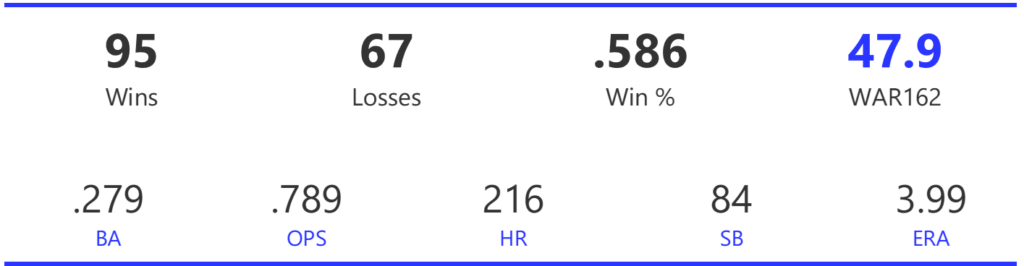
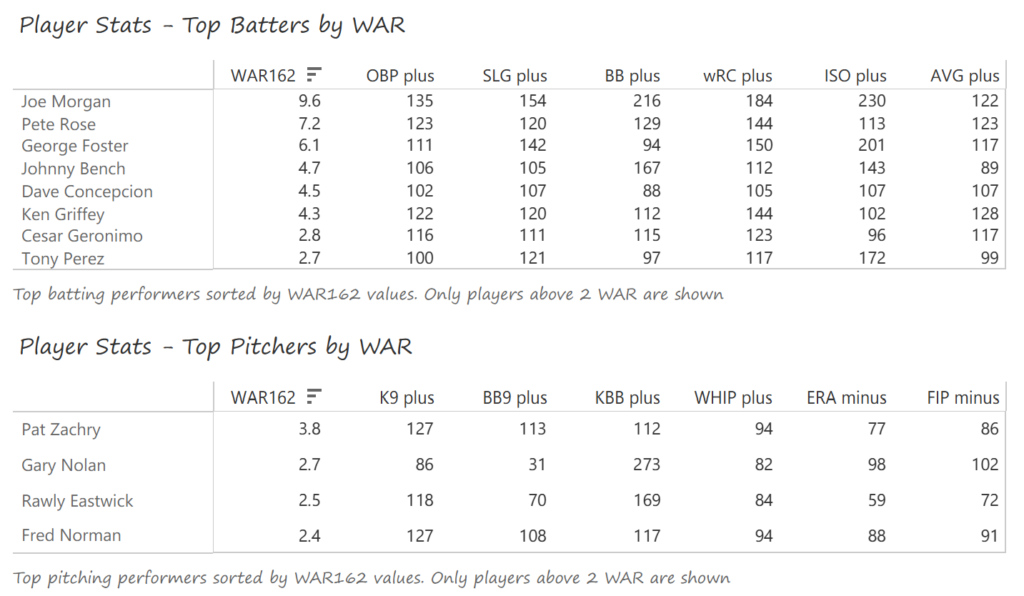
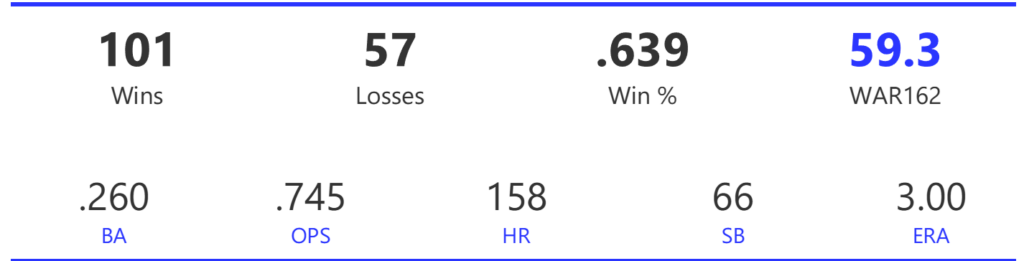
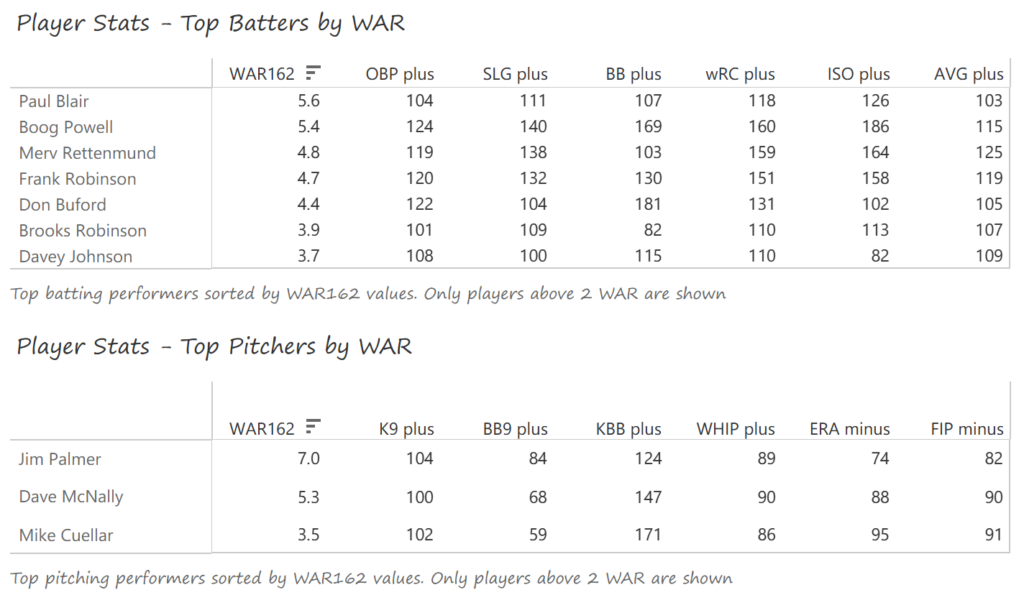
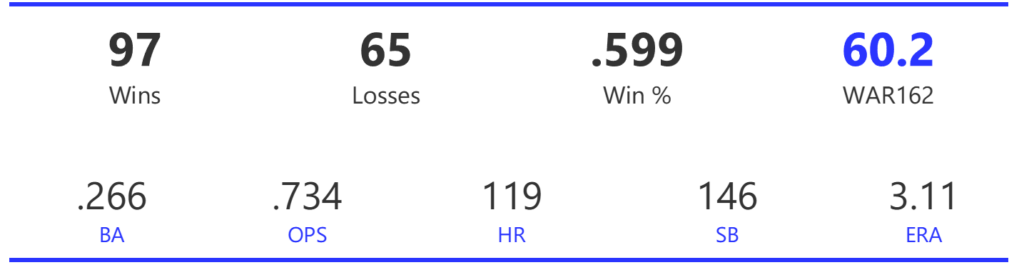
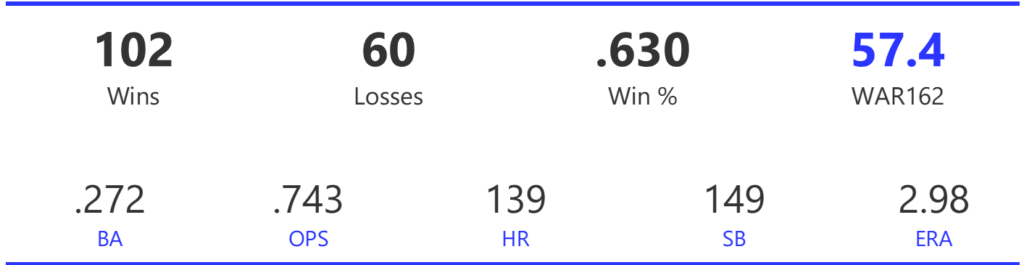
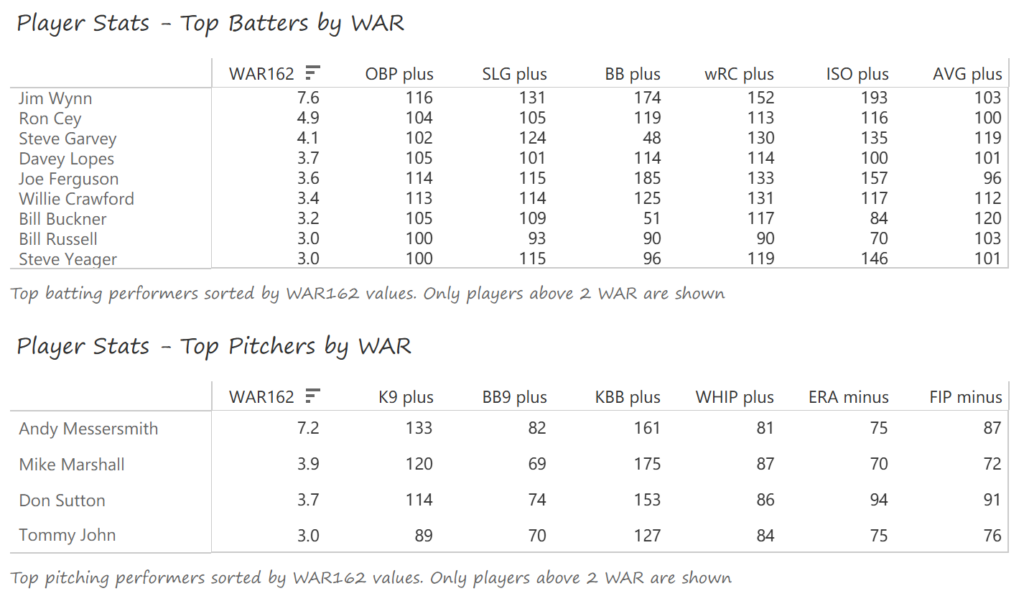
#4: 1997 Atlanta Braves, 58.1 WAR162
The 1997 Braves were another in a long line of great Atlanta teams in the 1990s. The Braves swept the Astros in the NLDS before being stunned by the 92-win Marlins in a six-game NLCS series.
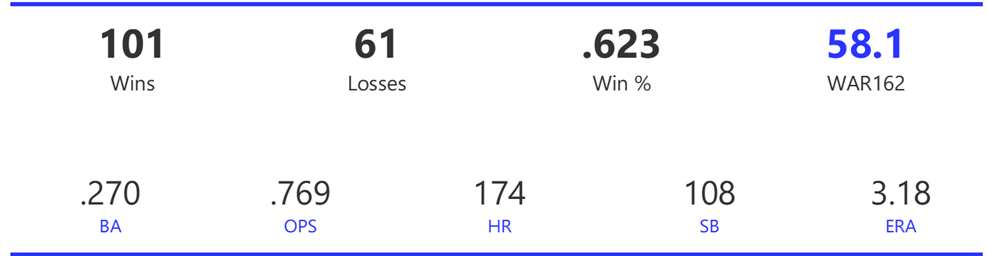
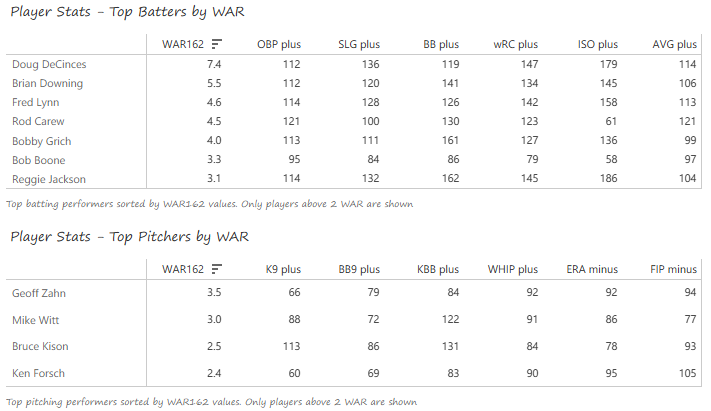
The Braves’ 791 runs ranked third in the NL, as did their .270 team BA. The team ranked fourth in OBP and second in OPS with a .769 mark. Starting pitching was again the real strength of the team, with their staff leading the NL by a wide margin in both ERA and WHIP. They also recorded the top strikeout-to-walk rate, courtesy of the fewest walks issued on the season.
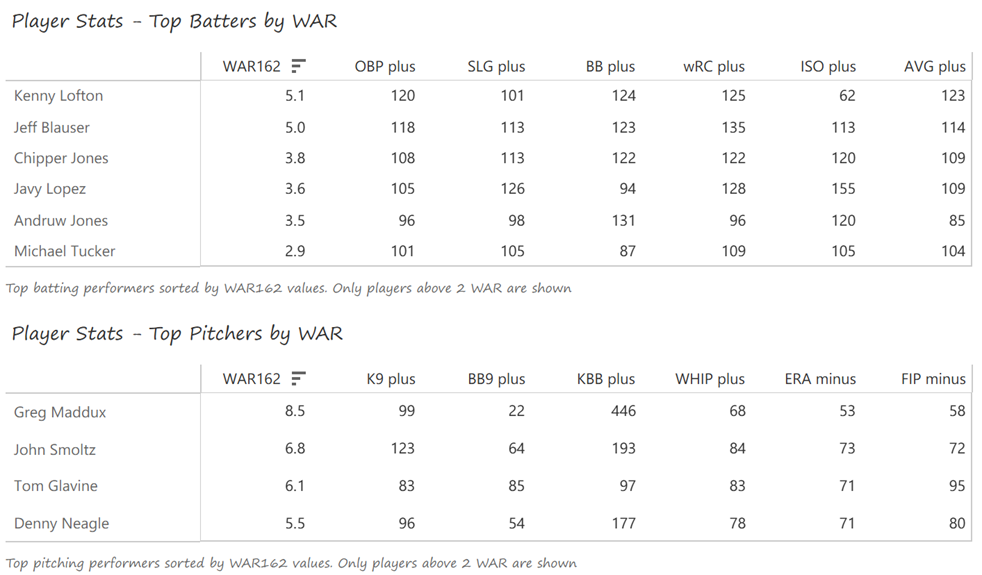
Kenny Lofton starred in his one season in a Braves uniform, batting .333 with 90 runs scored. Jeff Blauser batted .308 with a .405 OBP, and Chipper Jones batted .295 with 21 homers and 111 RBI. Catcher Javy Lopez swatted 23 homers with a .295 BA, and 20-year-old Andruw Jones added 18 more long balls. Greg Maddux had a sensational season with a 19-4 record, 2.20 ERA, and a ridiculous 8.85 strikeout-to-walk rate. John Smoltz posted 15 wins across an NL-best 256 innings, and Tom Glavine went 14-7. Denny Neagle recorded a 20-5 mark with a 2.97 ERA.
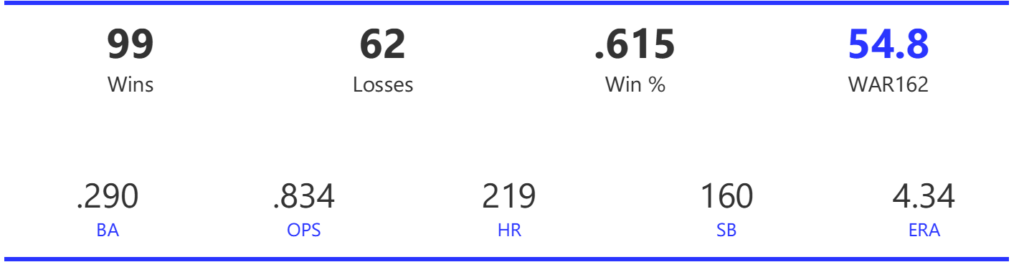
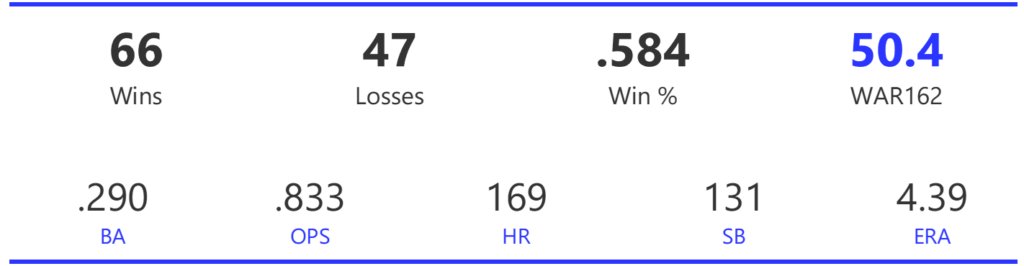
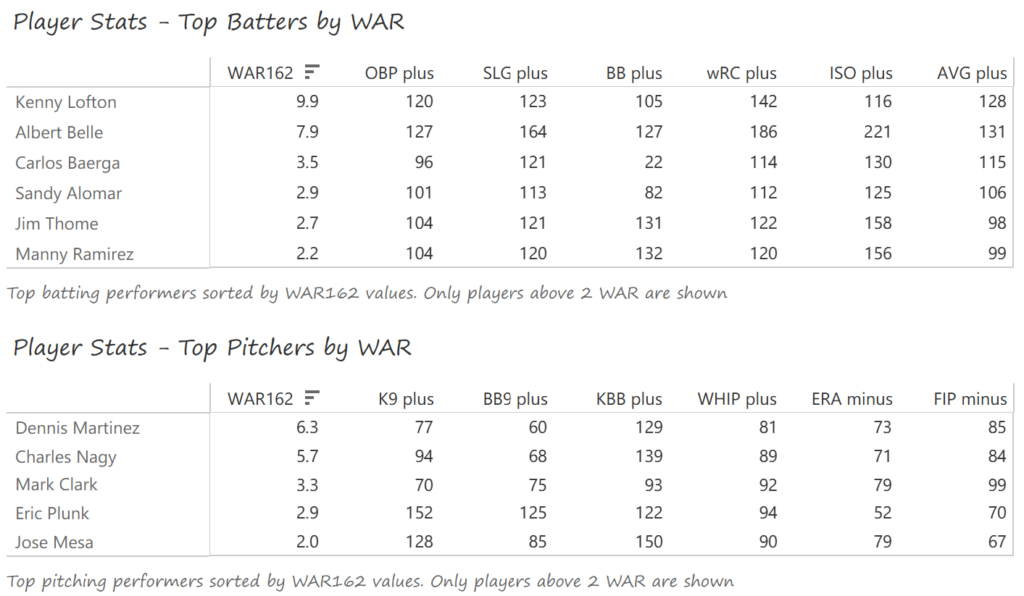
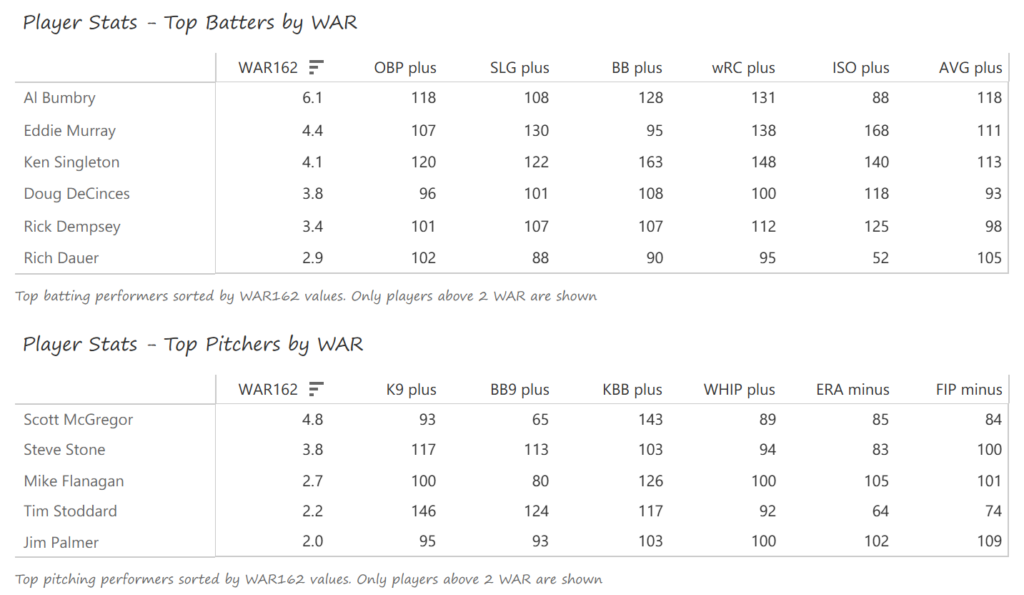
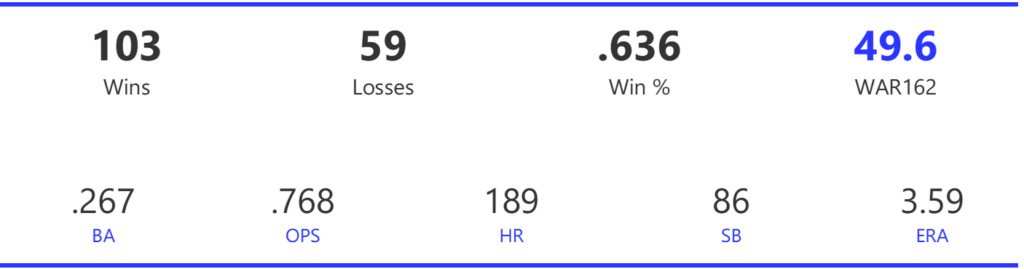
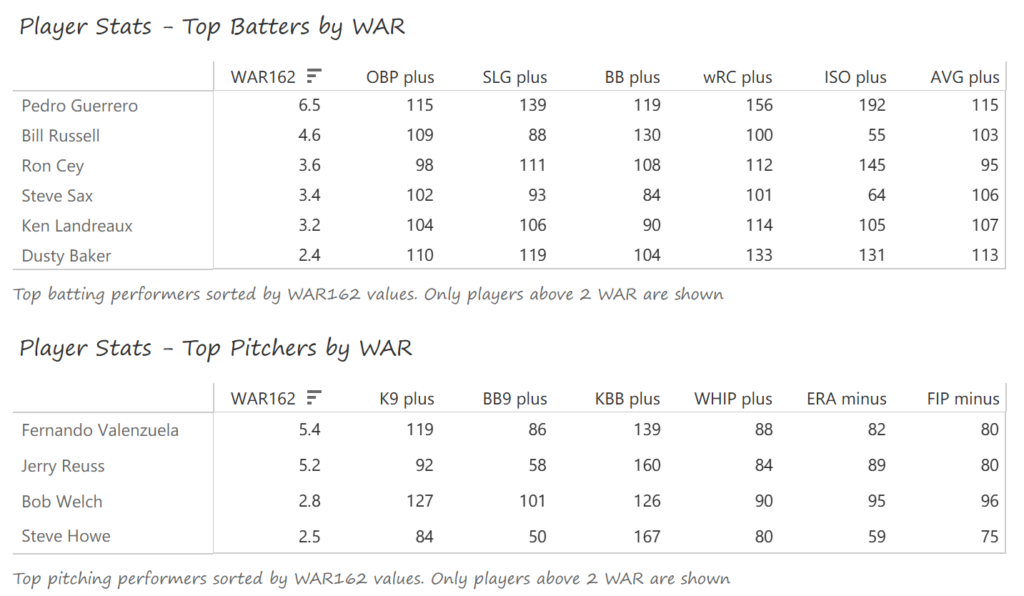
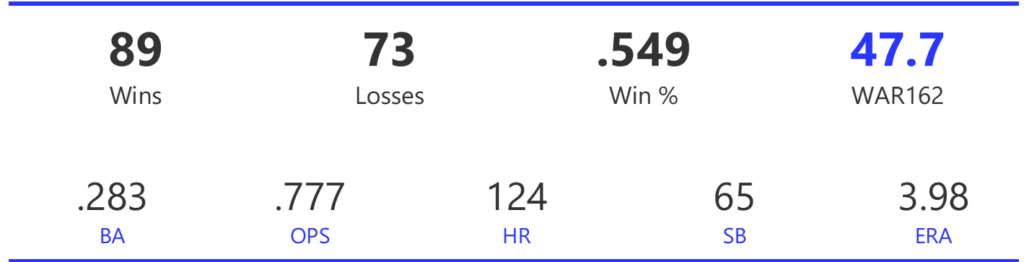
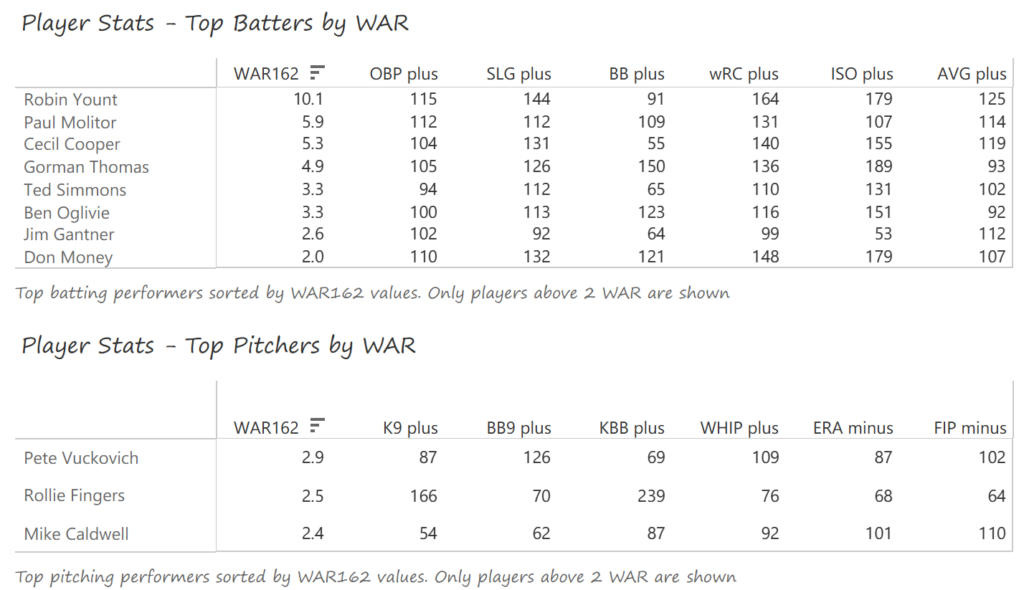
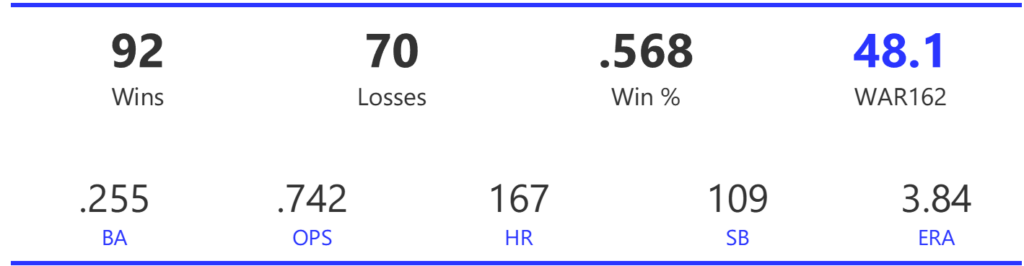
#3: 1995 Cleveland Indians, 59.1 WAR162
The 1995 Indians rolled to the AL Central crown, finishing a preposterous 30 games ahead of the Royals. They went on to sweep the Red Sox in a 3-game ALDS, before defeating the Mariners in six games to claim the AL pennant. The party ended with a six-game World Series defeat to the Braves.
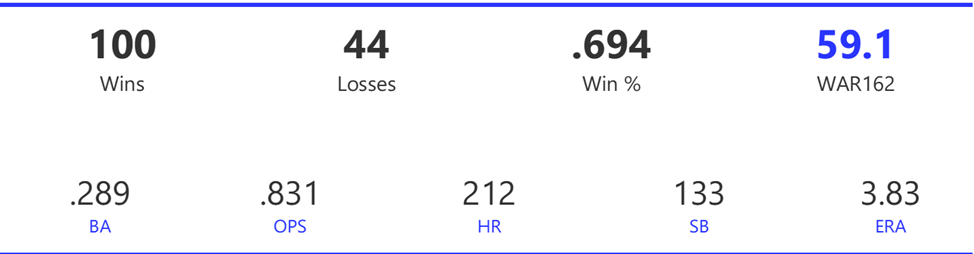
The Indians had a dominant offense, scoring 840 runs and bashing 207 homers in the abbreviated 1995 season. They also swept the BA, OBP, SLG, and OPS metrics, capped by an .831 OPS mark. For good measure, the Indians also topped the AL in stolen bases. Their pitching was also very effective, with the Cleveland staff topping the AL in ERA, WHIP, and strikeout-to-walk rate.
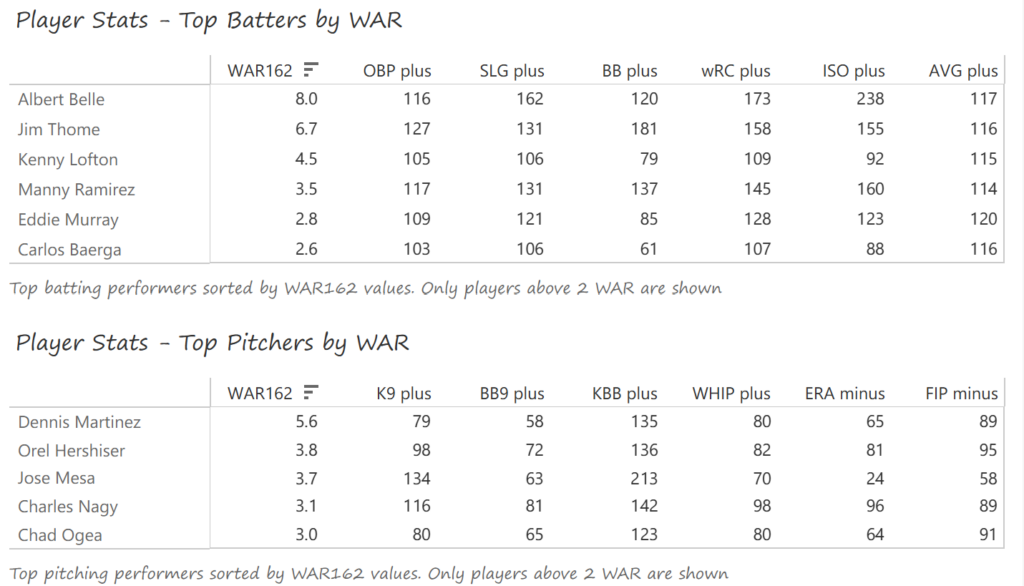
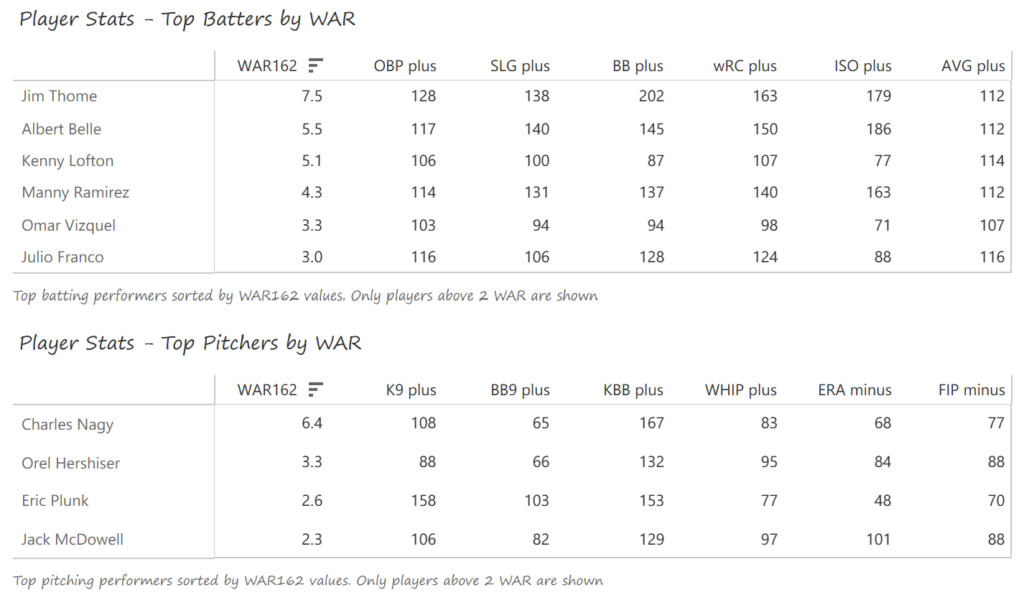
Albert Belle crushed AL pitching in 1995, with league-best totals in doubles (52), homers (50), RBI (126), and runs (121). Belle also batted .317 and sported a 1.091 OPS for the season. Jim Thome homered 25 times with 97 walks and a .438 OBP, and Kenny Lofton batted .310 with an AL-best 54 steals and a Gold Glove Award. Manny Ramirez (.308 BA, 31 homers, 107 RBI) was also a primary contributor. The pitching staff was led by 41-year-old Dennis Martinez, who posted a 12-5 record with a 3.08 ERA. Orel Hershiser and Charles Nagy each won 16 games, and Jose Mesa led the AL with 46 saves.
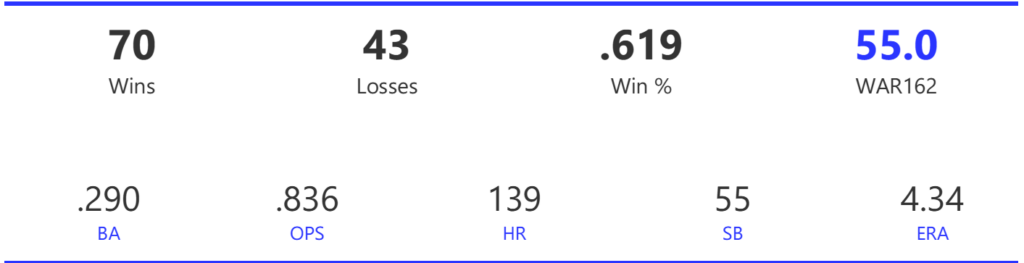
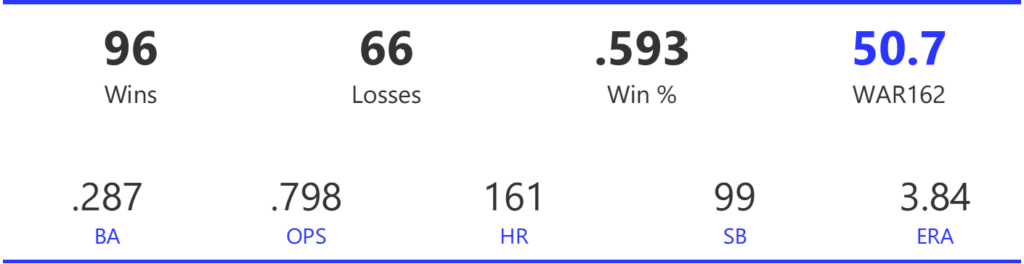
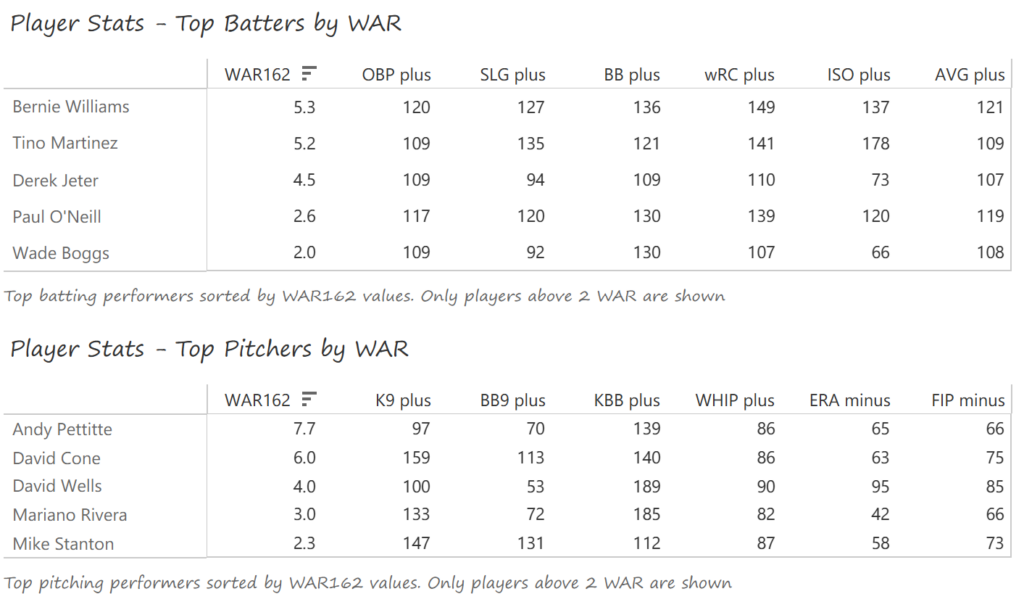
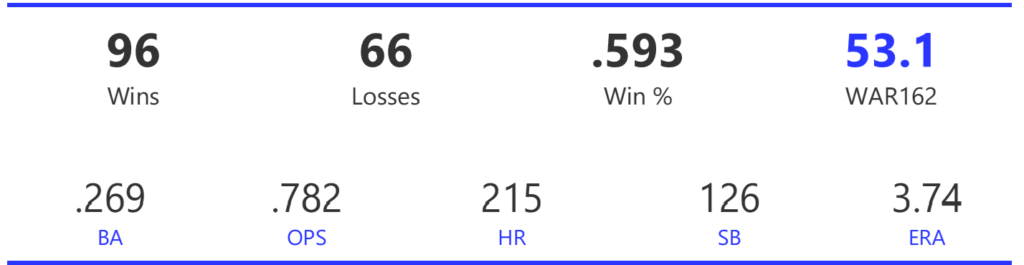
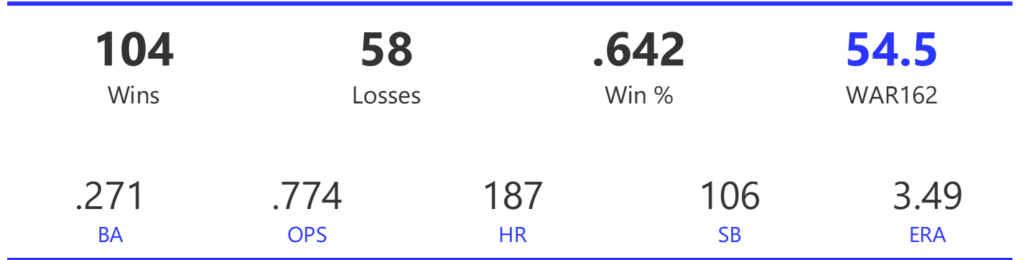
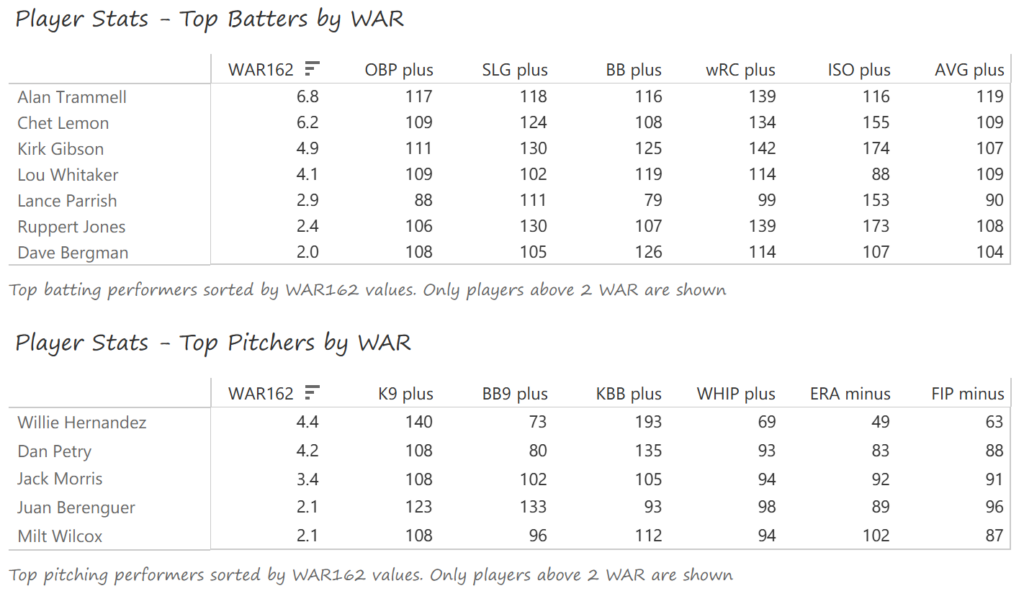
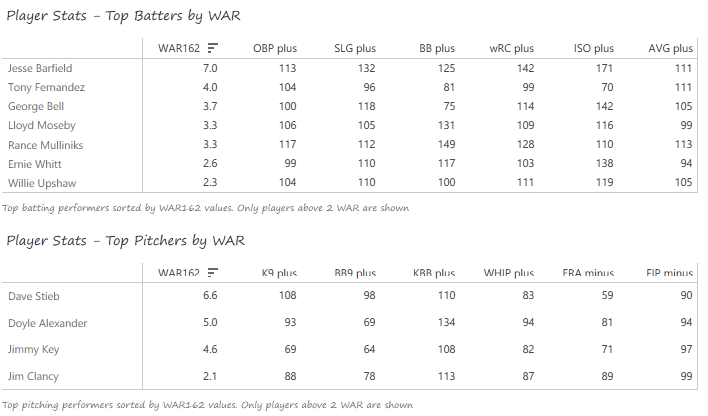
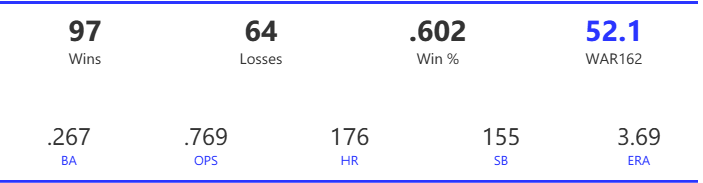
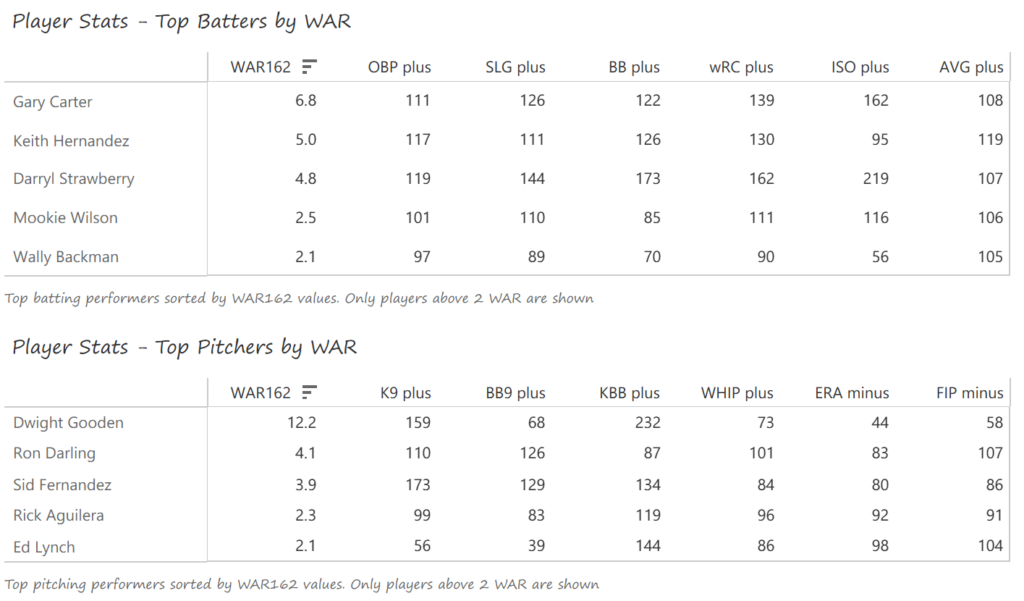
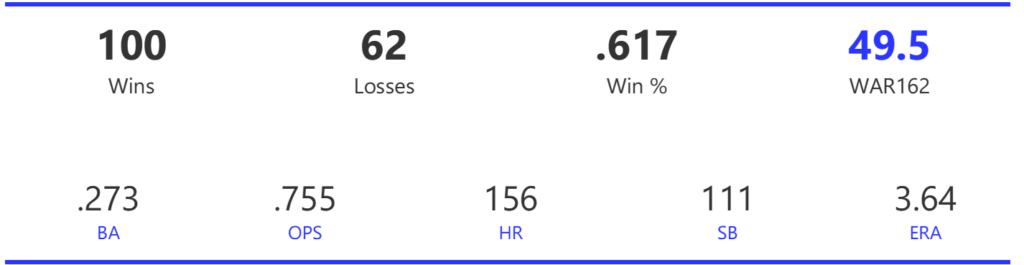
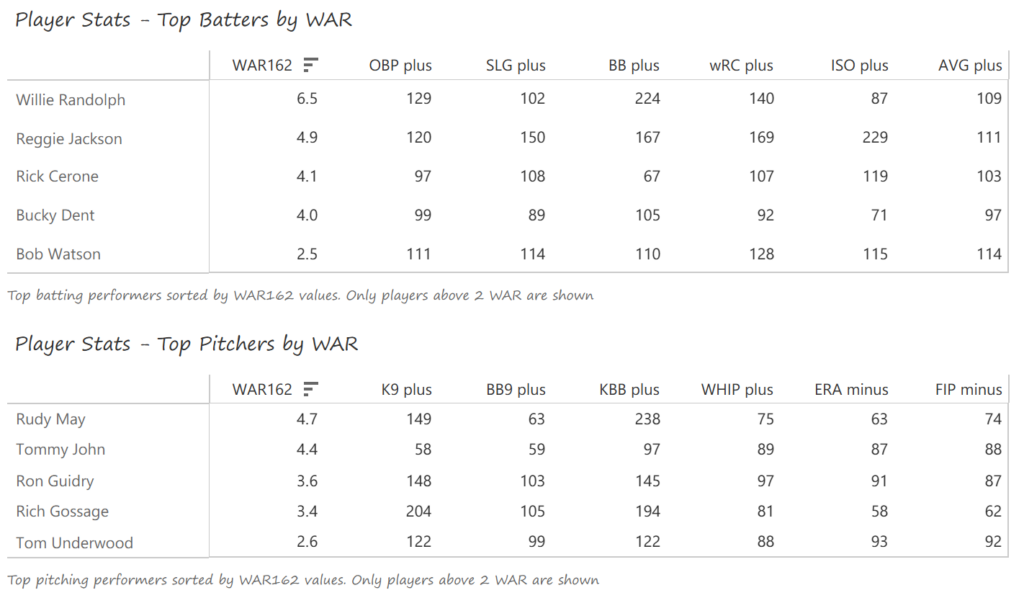
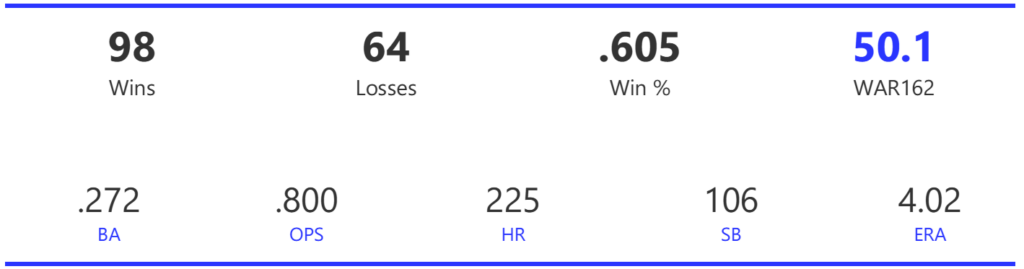
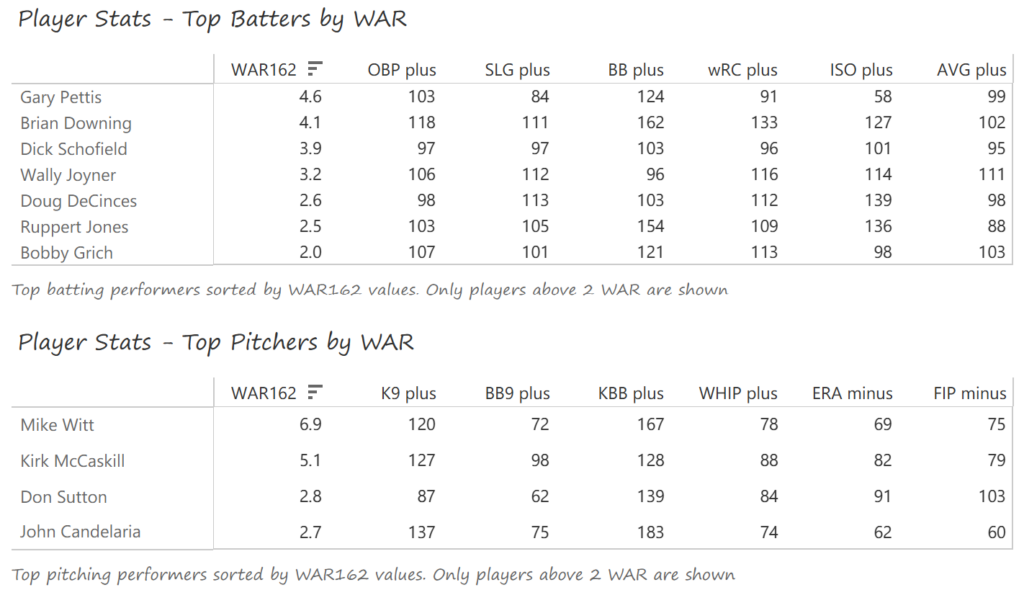
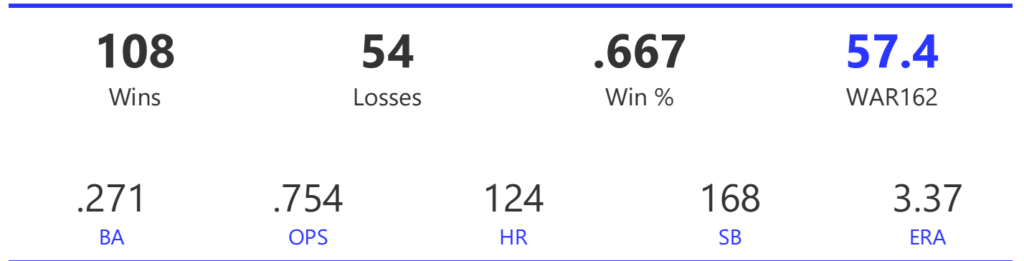
#2: 1998 New York Yankees, 62.2 WAR162
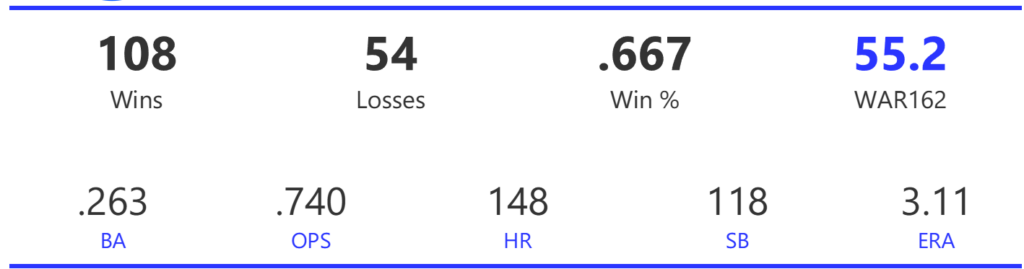
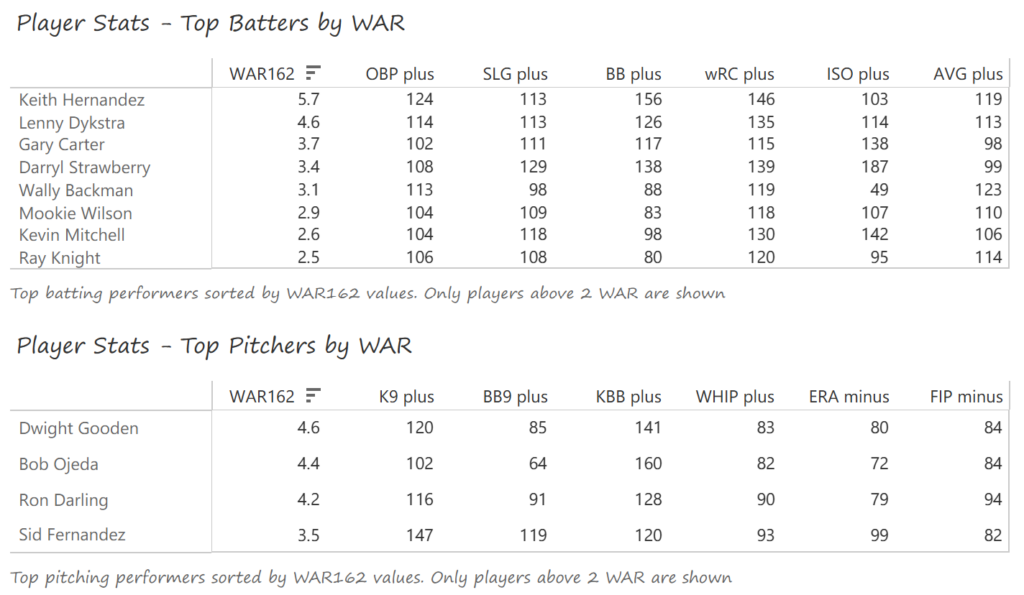
The Yankees had a season for the ages in 1998, topping the AL East by 22 games over the Red Sox. While they were projected for 108 wins (vs. 114), the Yankees were clearly the class of the American League. The New Yorkers went on to sweep the Rangers in the ALDS, defeat the Indians in a 6-game ALCS, and sweep the Padres in the World Series.
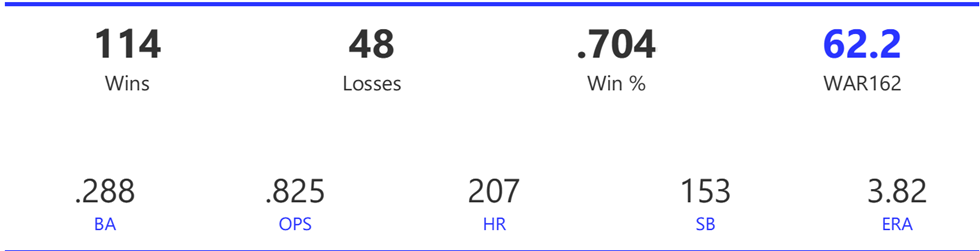
New York led the league with 965 runs, as well as in OBP and OPS, and ranked second in BA behind the Rangers. The Yankees’ staff was impressive, easily leading the AL in ERA and WHIP, plus strikeout-to-walk rate. They also issued the second-fewest walks in the AL in an impressive season.
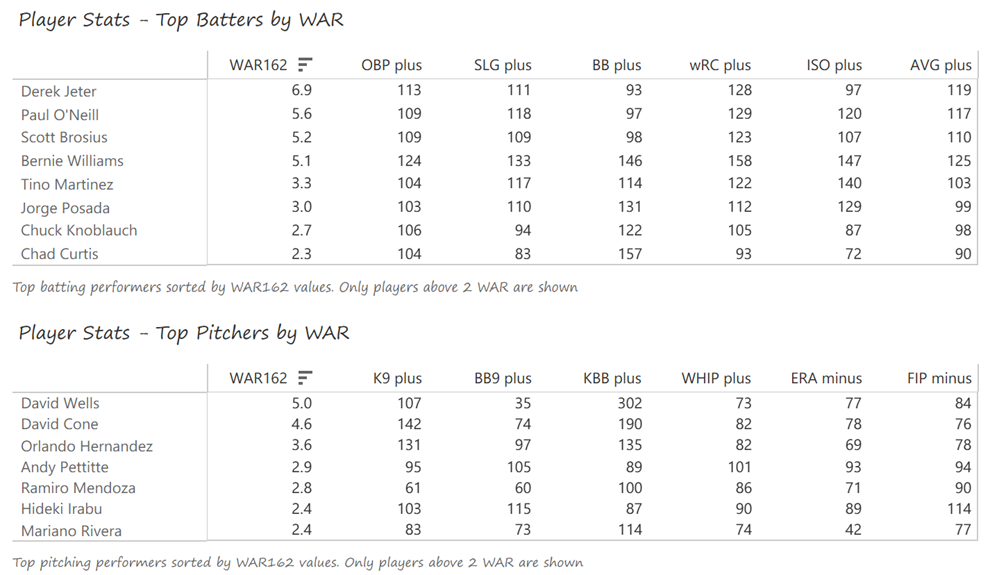
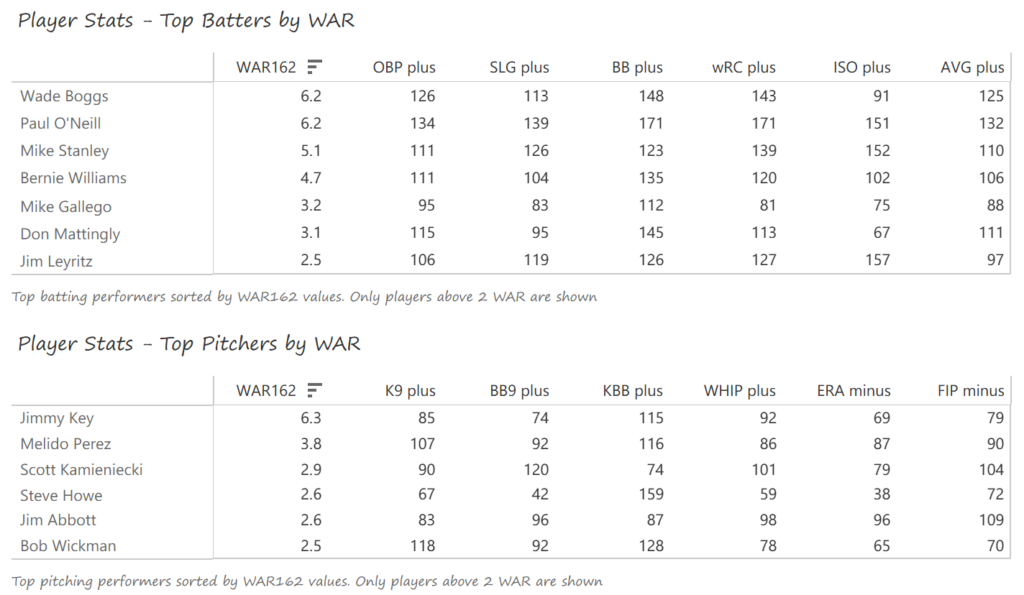
Derek Jeter led a deep offensive team, batting .324 with 30 steals and an AL-best 127 runs. Paul O’Neill batted .317 with 24 home runs and 116 RBI, and Scott Brosius batted .300 with 19 homers and 98 RBI. Bernie Williams won a Gold Glove in center field while topping the AL with a .339 BA and 26 homers in just 128 games. David Wells (18-4, AL-best WHIP) and David Cone (20-7, 209 strikeouts) led a deep staff, aided by Orlando Hernandez (12-4) and Andy Pettitte (16-11).
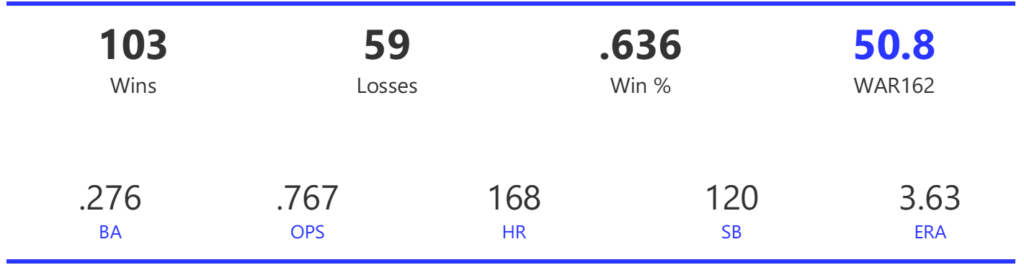
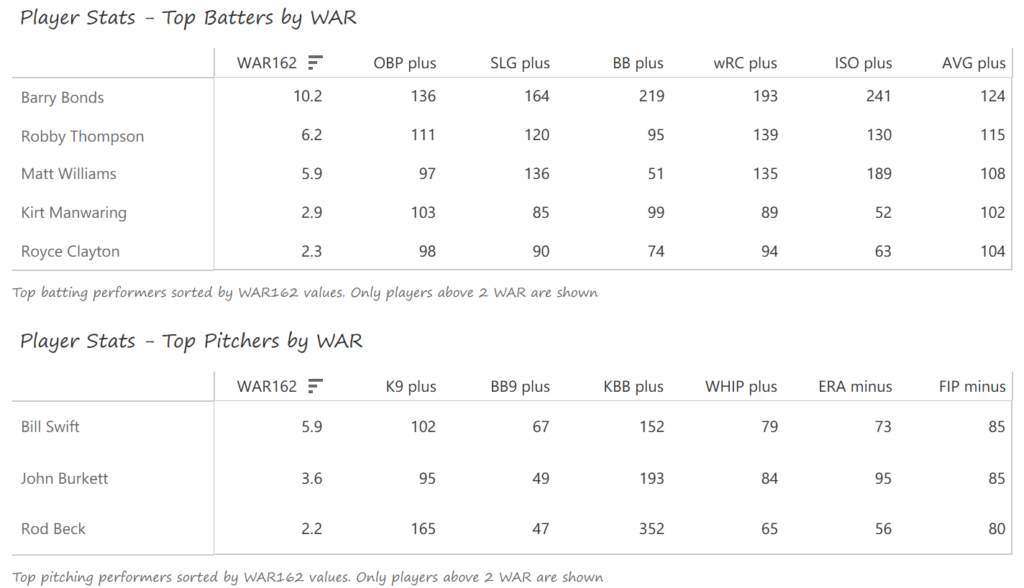
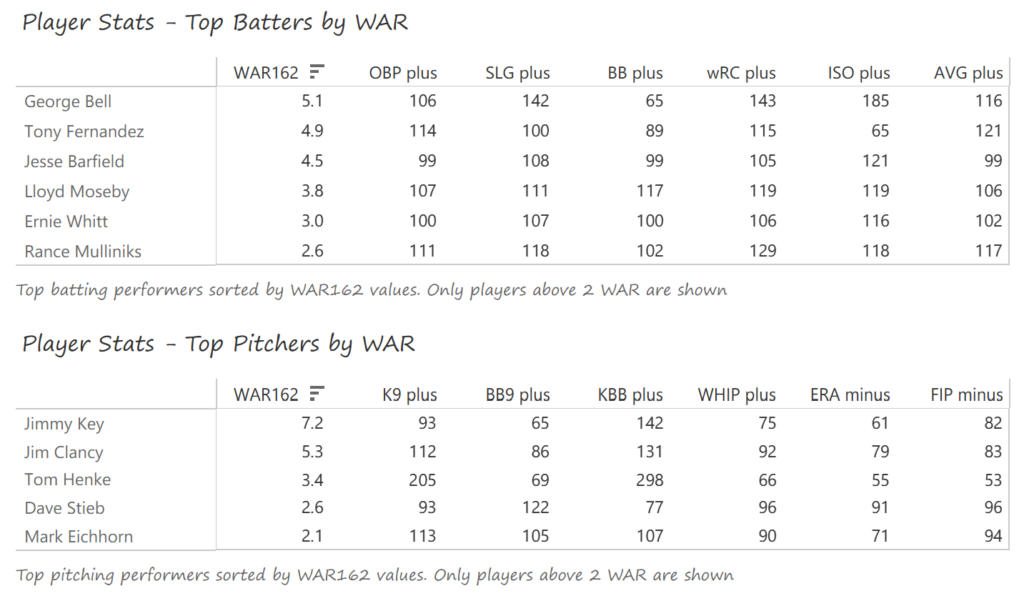
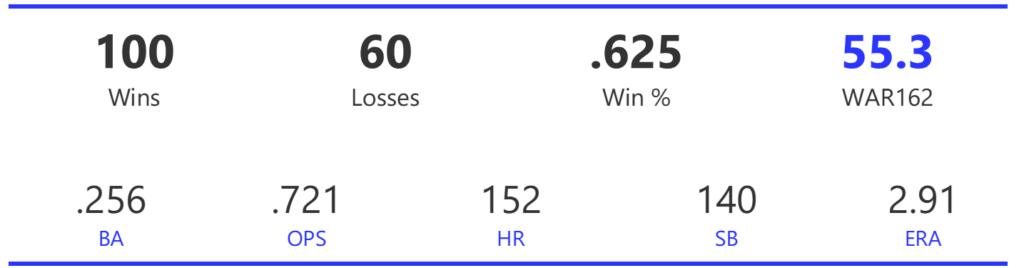
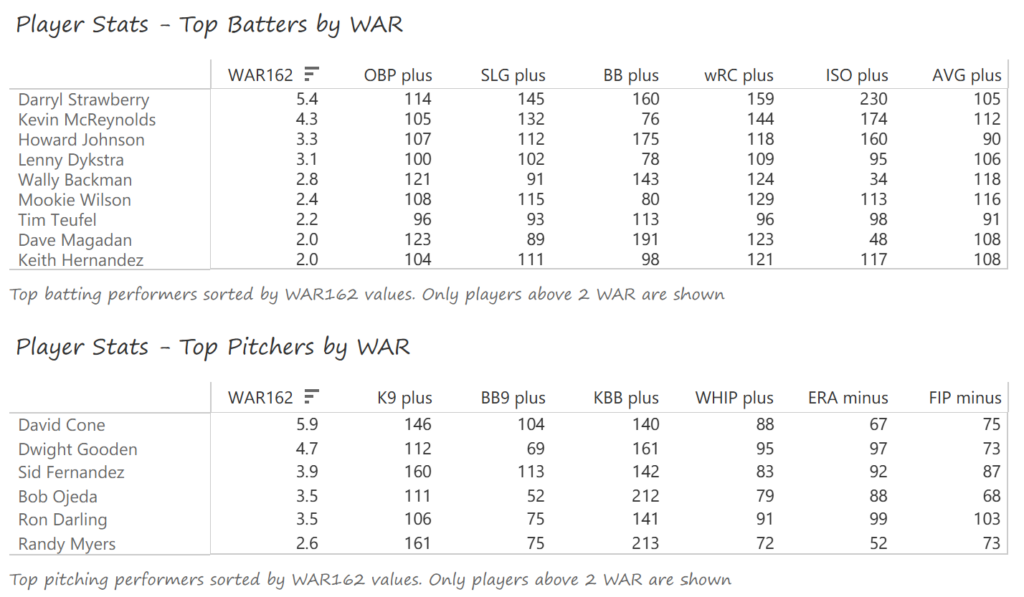
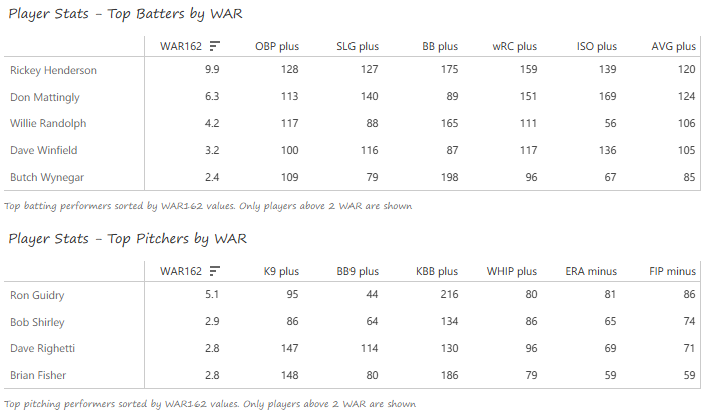
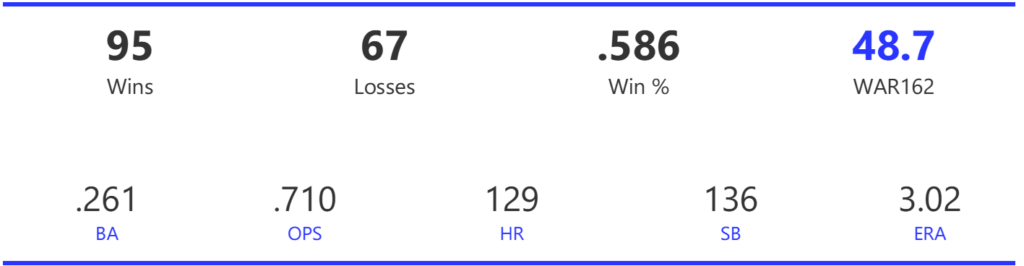
#1: 1998 Atlanta Braves, 62.8 WAR162
The 1998 Braves were likely the best Atlanta team of the decade, beating the Mets by 18 games to claim the NL East. After sweeping the Cubs in the NLDS, the Braves were stunned by the Padres in a 6-game NLCS.
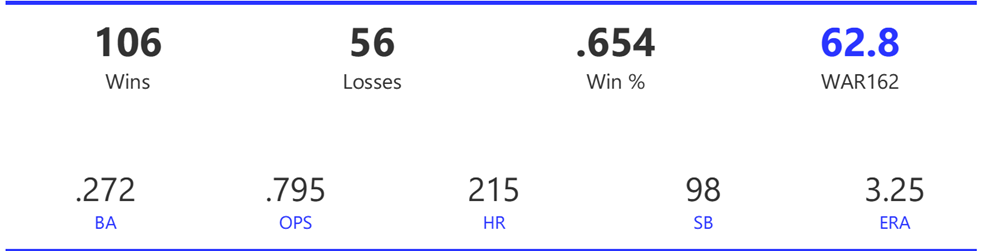
Atlanta featured a strong offense and its usual excellent pitching. The Braves scored 826 runs to rank fourth in the NL and finished second with 215 homers. The Braves ranked fourth in BA and OBP, and second in OPS for the season. The Atlanta staff led the league in ERA and WHIP by wide margins, and tossed a league-best 23shutouts. They were also tops in strikeouts and strikeout-to-walk rate.
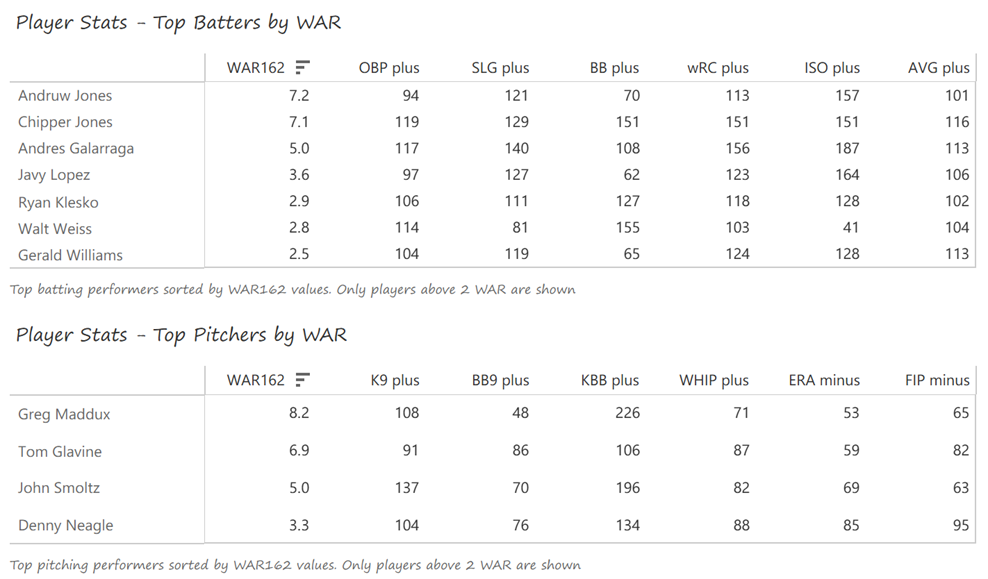
Andruw and Chipper Jones were the offensive stars for the Braves. Andruw launched 31 homers with 90 RBI and 27 steals in addition to his Gold Glove defense. Chipper batted .313 with 34 homers, 107 RBI, and 123 runs scored. Andres Galarraga belted 44 homers with 121 RBI and a .305 BA, while Javy Lopez ripped 34 home runs with 106 RBI from his catcher position. Greg Maddux had another stellar season on the mound, recording a 18-9 mark and leading the league in shutouts (5), ERA (2.22), and WHIP (0.980). Tom Glavine (20-6, 2.47 ERA, Cy Young Award) and John Smoltz (17-3) rounded out a scary top of the rotation.
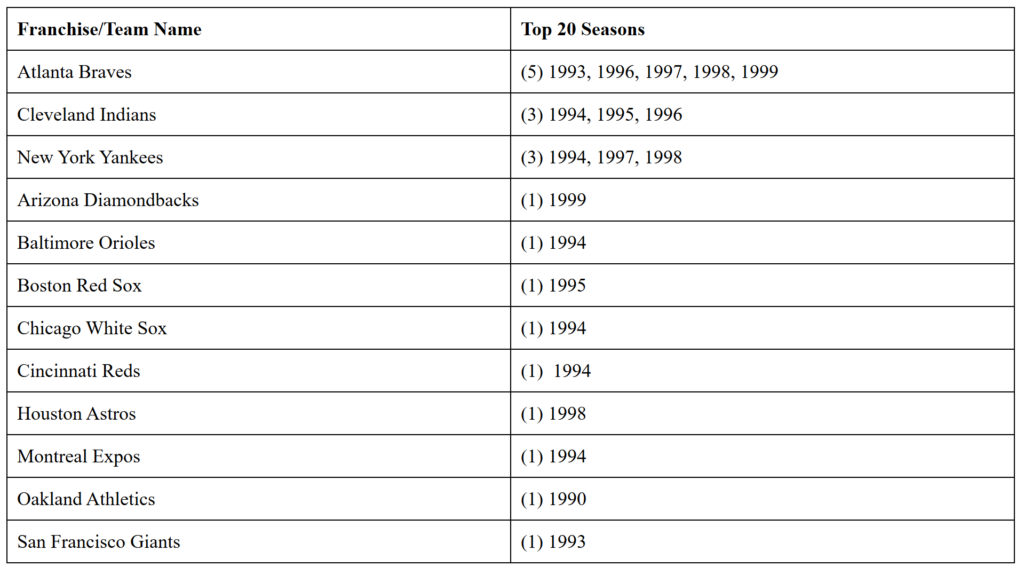
Summary
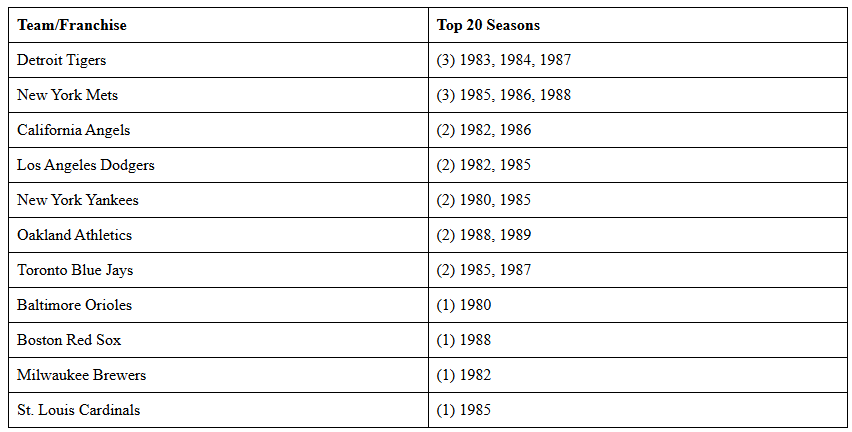
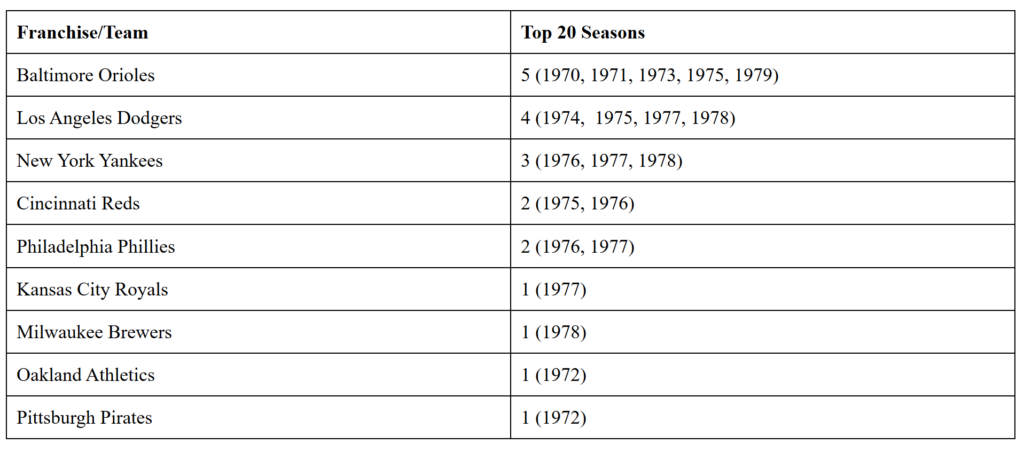
That’s it for the final entry in our MLB Team Rankings for the 1990s decade! Here’s a summary of the most dominant franchises of the 1990s: