Category: Uncategorized

Angels Radial Axis Network

Our first entry in the MLB Radial Axis Series features the Angels in all their editions – California, Anaheim, Los Angeles, etc. We’re going to walk through some highlights from the network, and then provide the link so you can explore it in detail. For some background on how the network graphs work, select this link – Anatomy of MLB radial axis graphs.

The Angels Network

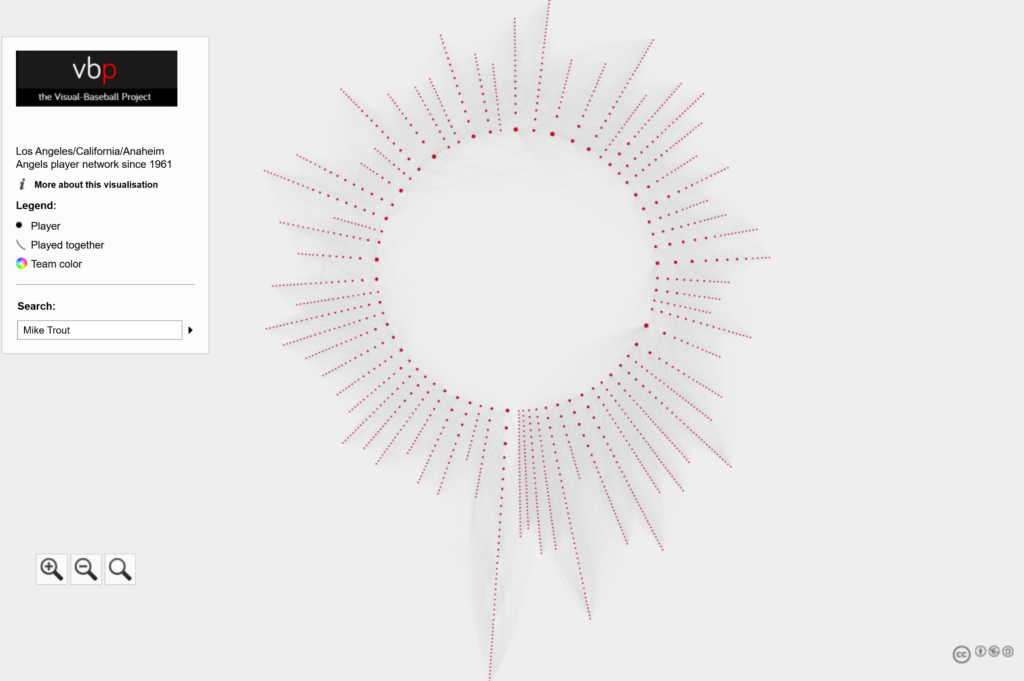
The Angels’ radial axis network reflects the connections between all players who spent time with the franchise between the 1961 and 2025 seasons. The first season (1961) is found at the bottom center. Subsequent seasons are arranged clockwise, eventually returning to the bottom center with the 2025 season. Player nodes are sized based on the number of seasons spent with the team, and the gray lines between nodes reflect connections to other players. The interactive version of the network is here – Angels Network.

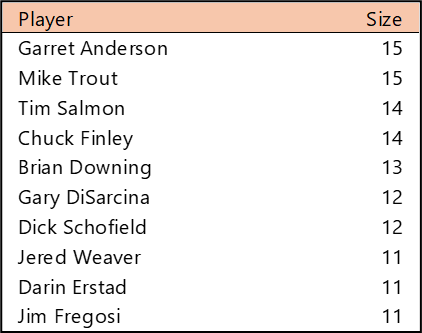
Top 10 by Seasons Played (Size)

Garret Anderson and Mike Trout top the Angels with 15 seasons on the roster (through 2025). Trout is now in his 16th season, so he’ll be alone atop any future list. Other long-tenured Angels legends include Tim Salmon, Chuck Finley, and Brian Downing.

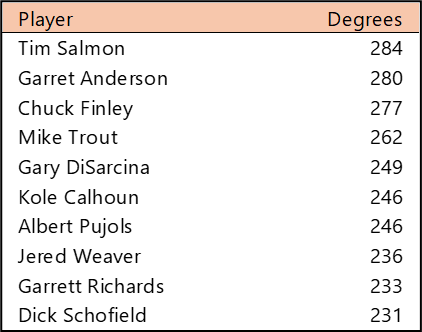
Top 10 by Degree (the number of connections)

Tim Salmon tops the Degree list, having been on a roster with 284 other players across his Angels career. Garret Anderson and Chuck Finley are close behind, with Mike Trout poised to eventually pass everyone.

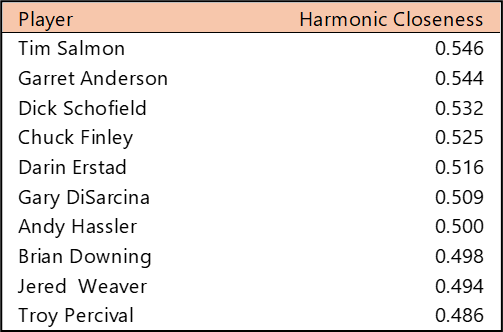
Top 10 by Harmonic Closeness Centrality

The Harmonic Closeness metric measures the relative importance of a player (based on their average distance from all other players) within a franchise’s history. This can be affected by both the number of degrees and the proximity to other well-connected players. On a scale from 0 to 1, Tim Salmon and Garret Anderson earned nearly identical scores atop the rankings. Dick Schofield, Chuck Finley, and Darin Erstad round out the Angels’ top five.

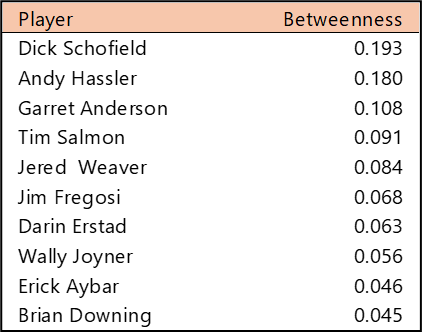
Top 10 by Betweenness Centrality

Betweenness Centrality measures which players are most central to the network. Often, this results in players who played in the middle period of a franchise’s history, or players with multiple stints with one franchise. The latter is the case for both Dick Schofield (1983-92, 1995-96) and Andy Hassler (1971-76, 1980-83). These two players provide the shortest paths to connect to other Angels players. Garret Anderson, Tim Salmon, and Jered Weaver are next, but far behind Schofield and Hassler.

Summary

That’s it for our overview of the Angels network. Be sure to visit the interactive graph to discover additional insights about the Angels players over the last 65 seasons. We’ll be back shortly with our next franchise entry. Thanks for reading!

Tableau MLB Team Dashboard (1901-1909) Is Live

The first MLB Team Dashboard is available on Tableau Public – Top 20 Teams, 1901-1909. The dashboard provides the data for my Top 20 MLB Teams countdown, which starts today with teams #20 through #16 from the same decade. Here’s a look at the dashboard:

Users can interact with the MLB Team Dashboard 1901-1909 in multiple ways:

  • By inputting a number between 1 and 20, to see the corresponding ranked team
  • By using the dropdown list to update the data in the distribution chart; runs, hits, doubles, and more can be shown at game levels
  • By hovering over any display item to reveal more information about that data point

The dashboard provides a fun, easy way to discover new insights about the top teams of the decade (based on the WAR162 metric).

Future dashboards will be rolled out roughly every two weeks; by early August we’ll have every decade through the 2010s covered. Enjoy using the dashboard, and watch for regular countdown updates.

Welcome to 2022!

I for one am looking forward to 2022 after a couple of interesting, often challenging years affected my desire to generate interesting analytics and data visualizations. The less said the better – simply excited to get back to updating some existing visuals and adding a host of new ones.

I’ll be doing a lot of work using the Exploratory toolkit which keeps improving by the day. It is simply a great tool for handling large (or small) data sets from start to finish; I especially love it’s data wrangling capabilities.

On the data source side, Retrosheet and the Lahman database will continue to feed my analysis and visuals; none of what I create would be possible without these great resources. Retrosheet data (used for game level and play level detail) is already updated through the 2021 season; part of this year’s plan is to add older years (pre-1955) to my local database. The Lahman data (season level) is typically available around February and I’ll be downloading it to my databases at that time.

Stay tuned for updates throughout 2022 – they should be a lot more frequent than the last two years. Happy New Year!

Recapping 2017

Observers of this blog will note that posts were scarce in 2017 – in fact this is the only one, and it’s being completed in 2018! This is the result of a variety of causes, including external projects, busy schedules, and focus that was shifted in other, unrelated directions. Still, 2017 was not without its moments.

For starters, I managed to create three data visualization courses for Packt:

Learning Data Visualization

Data Visualization Techniques

Advanced Data Visualization

Retrosheet data for the 2016 and 2017 seasons has also been downloaded, and is in the update process as we speak, which will enable some new visualization work (and perhaps a new book title) in 2018. Soon, annual season data from the Baseball-Databank and Sean Lahman will be available as well.

I’m also in the process of launching a new site at jazzgraphs.com, where I’ll use network visualizations to uncover the complex web of relationships between jazz musicians, labels, and recordings. Posters and a book are in the plans for 2018, so stay tuned.

Wishing all a happy and prosperous 2018, and I promise more content to come this year!