Welcome to the third countdown post in our series of MLB team rankings for the 1970s. Expansion continued in the 1970s, with four new teams added for the 1977 season, adding to the four that started play in the 1969 season. As a reminder, the teams are ranked from #20 through #1 based on aggregate WAR162. For the 1970s (1970-1979), a total of 252 team-seasons were eligible, so the top 20 teams are a rather exclusive group – the top 8% for the decade. We’ll summarize each team, including portions of their team dashboard, and explain how they attained their ranking. So, without further ado, here are the teams ranked #5 through #1.
Here’s the interactive dashboard at Tableau Public: 1970s Top 20 MLB Teams Dashboard
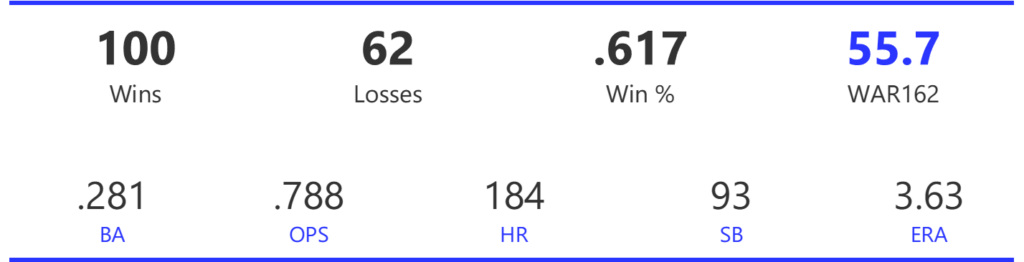
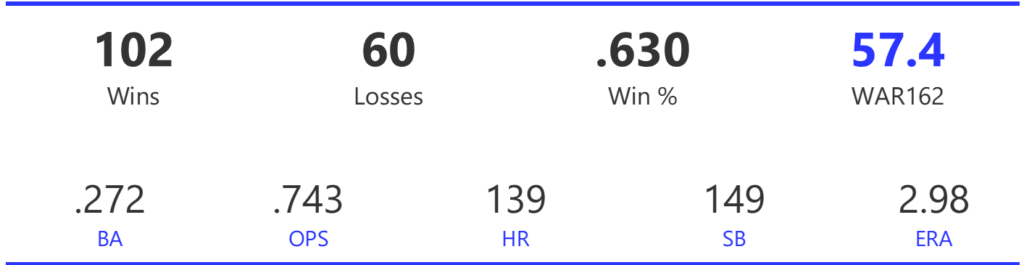
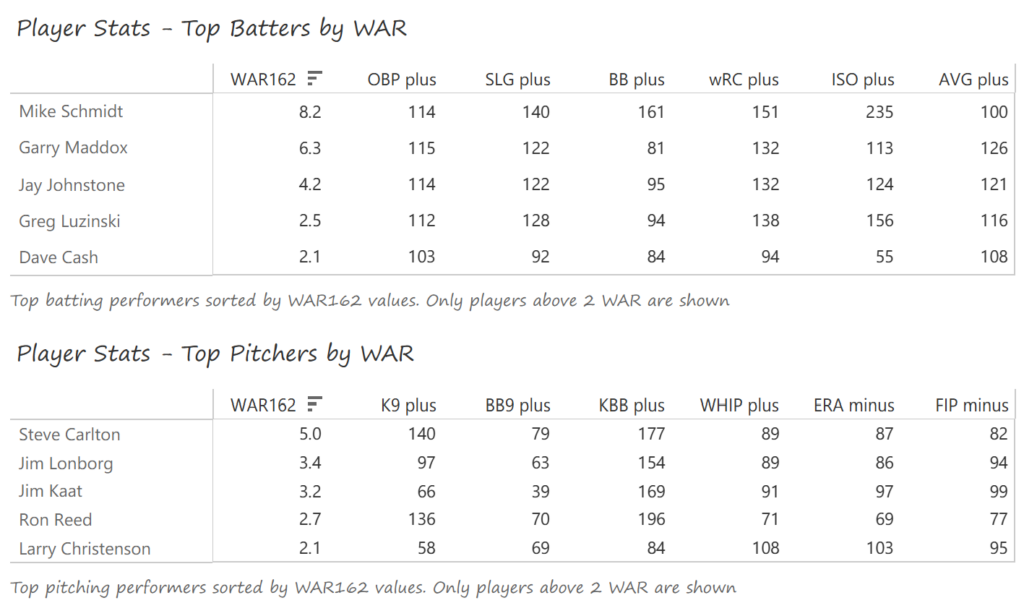
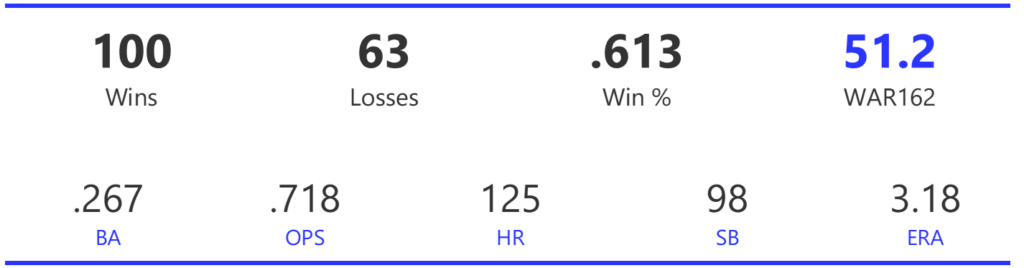
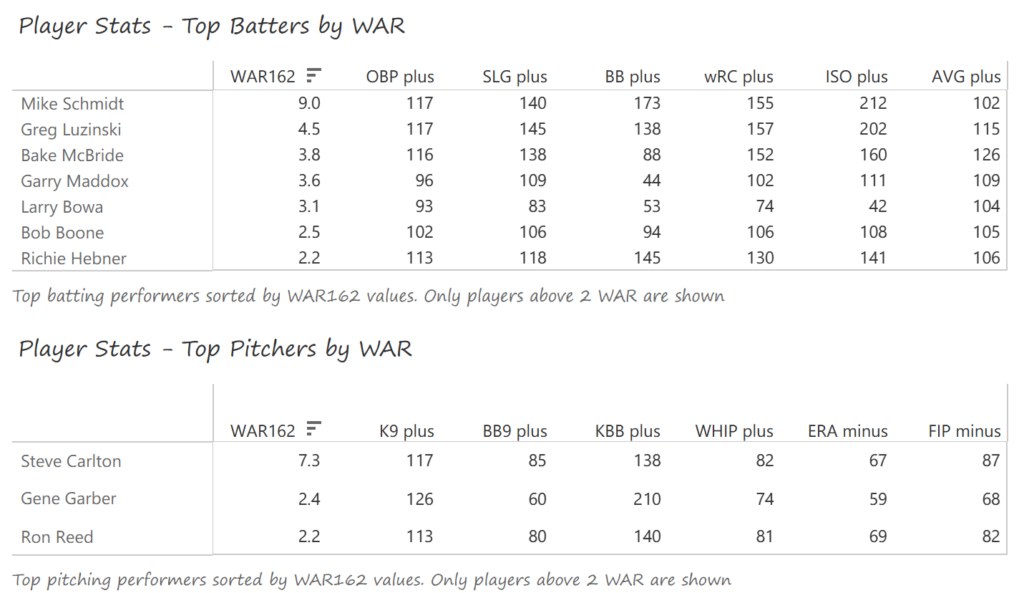
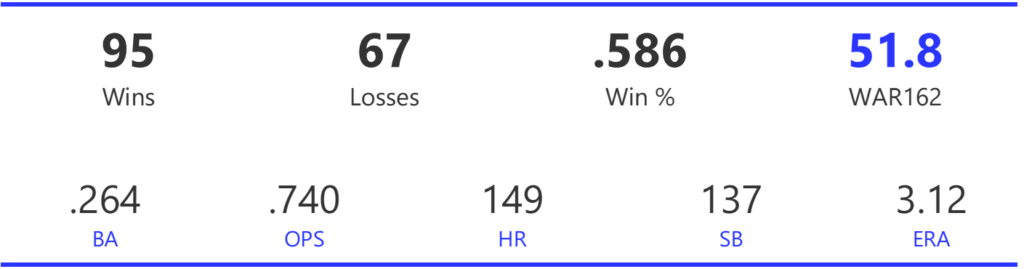
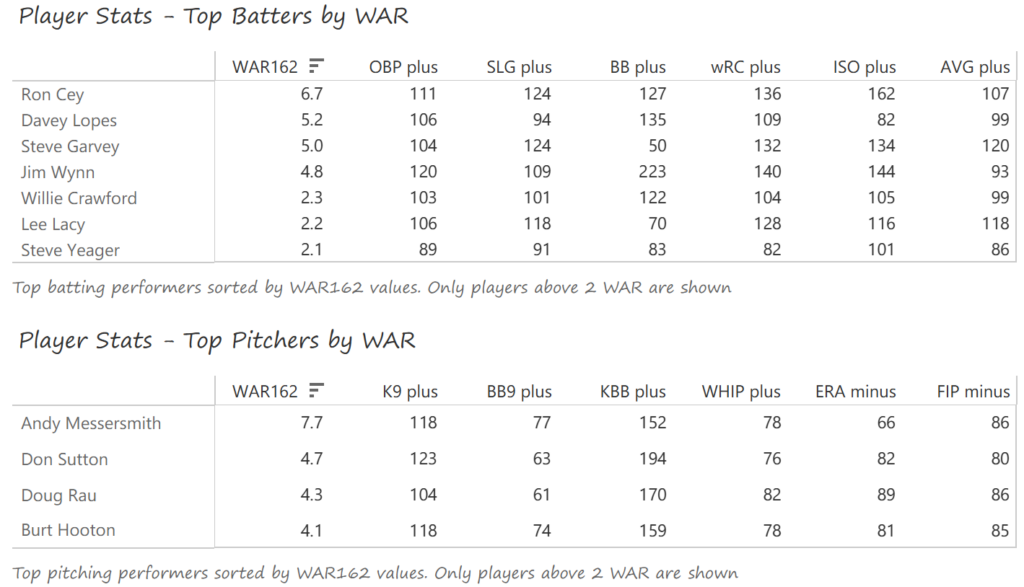
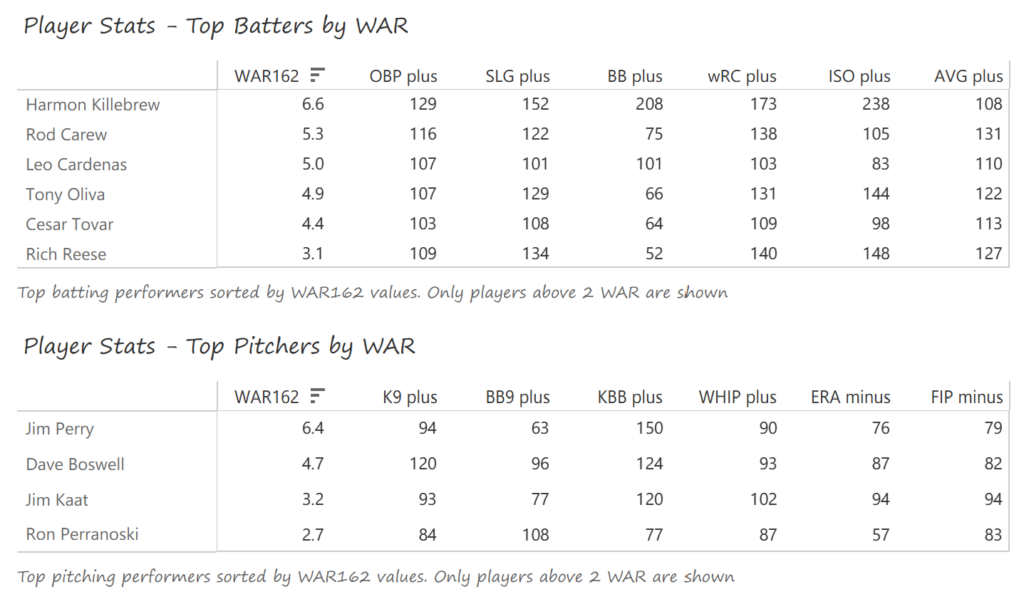
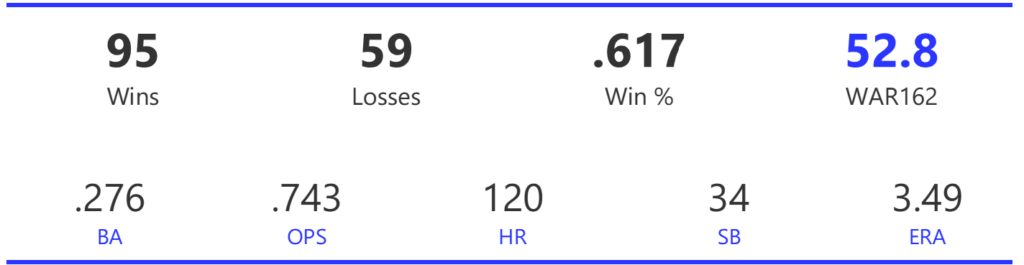
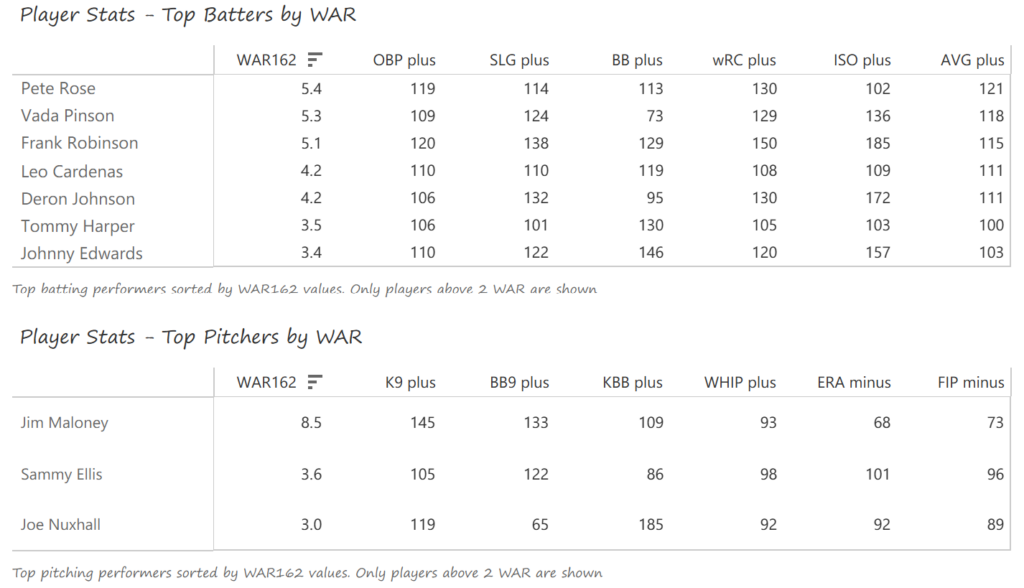
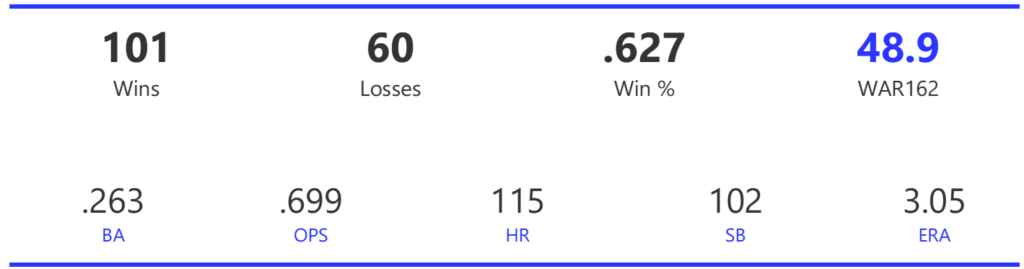
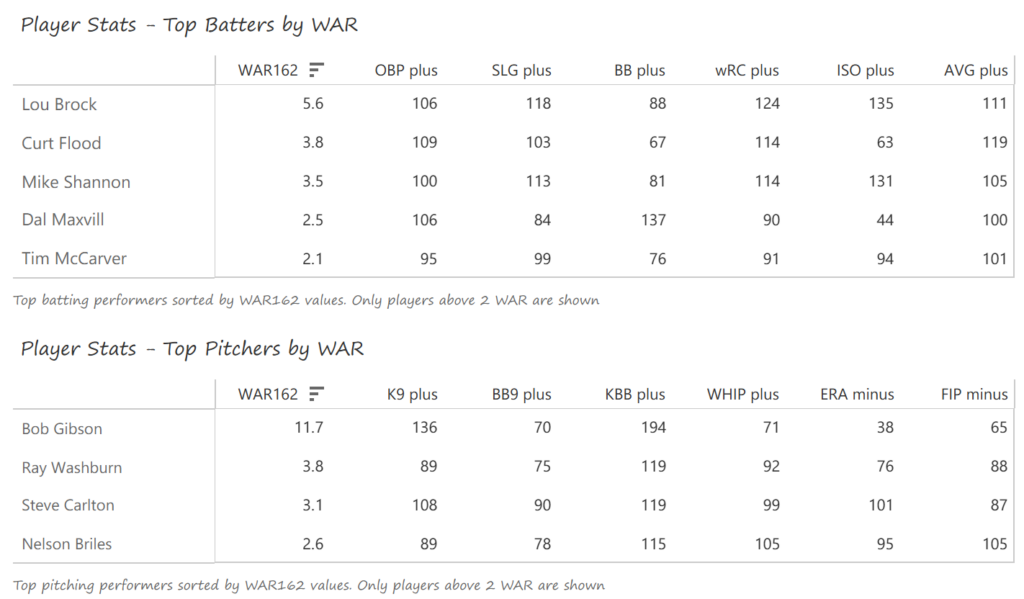
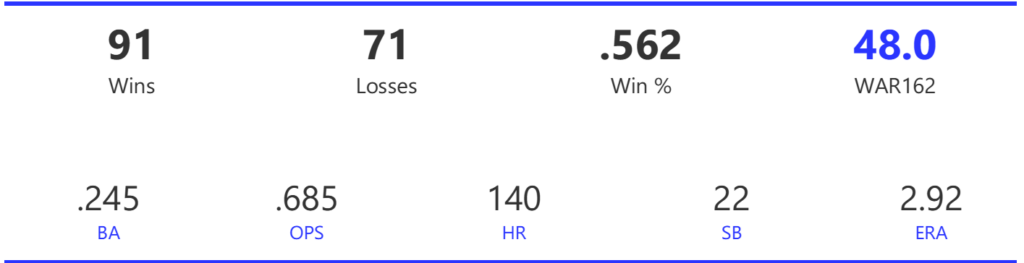
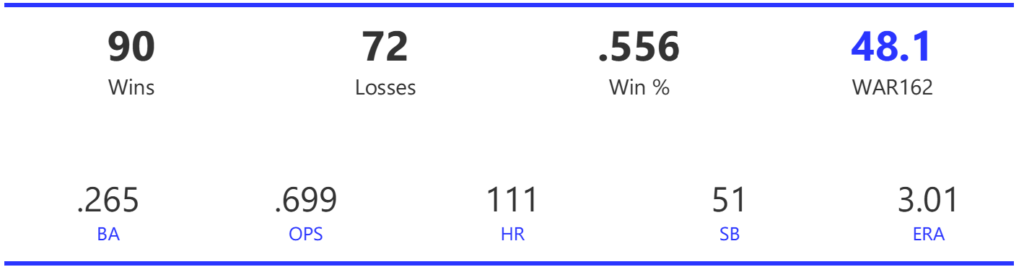
#5: 1975 Cincinnati Reds, 57.4 WAR162
The Reds and Orioles own the top five spots in our 1970s rankings. The list starts with the 1975 Reds, who posted a gaudy 108 wins before sweeping the Pirates in the NLCS. They then defeated the Red Sox in a classic seven-game World Series.
The Reds had an impressive offense in 1975, scoring 840 runs, 105 more than their closest rival. Their 124 homers ranked third, and their 168 stolen bases topped the NL. The team ranked second in BA and first in OBP and OPS. The Reds’ pitching staff was less notable, but still quite effective, ranking third in ERA, fourth in WHIP, and second in walks issued.
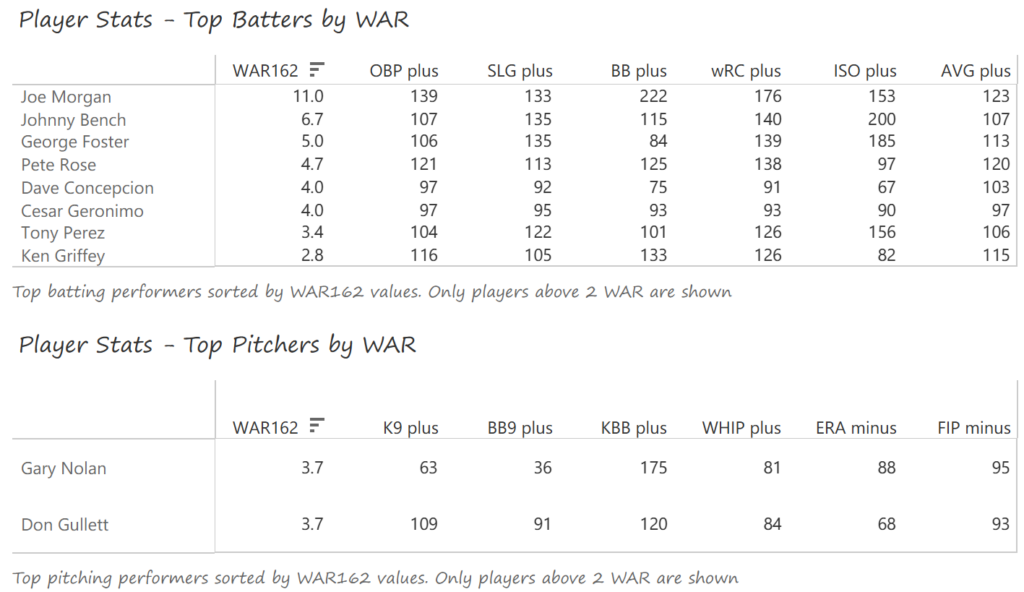
Joe Morgan had a sensational season en route to NL MVP honors. Morgan batted .327, and led the NL with 132 walks, a .466 OBP, and a .974 OPS. He also stole 67 bases, scored 107 runs, and earned a Gold Glove at second base. Johnny Bench assembled a big season as well, swatting 28 homers with 110 RBI and a Gold Glove. George Foster added 23 homers and a .300 BA, while Pete Rose batted .317 with NL-bests in doubles (47) and runs (112). Dave Concepcion (.274 BA, 33 steals, Gold Glove) and Cesar Geronimo (Gold Glove) were also major contributors for the Big Red Machine. Gary Nolan and Don Gullett (2.42 ERA) each won 15 games for a balanced Reds pitching staff.
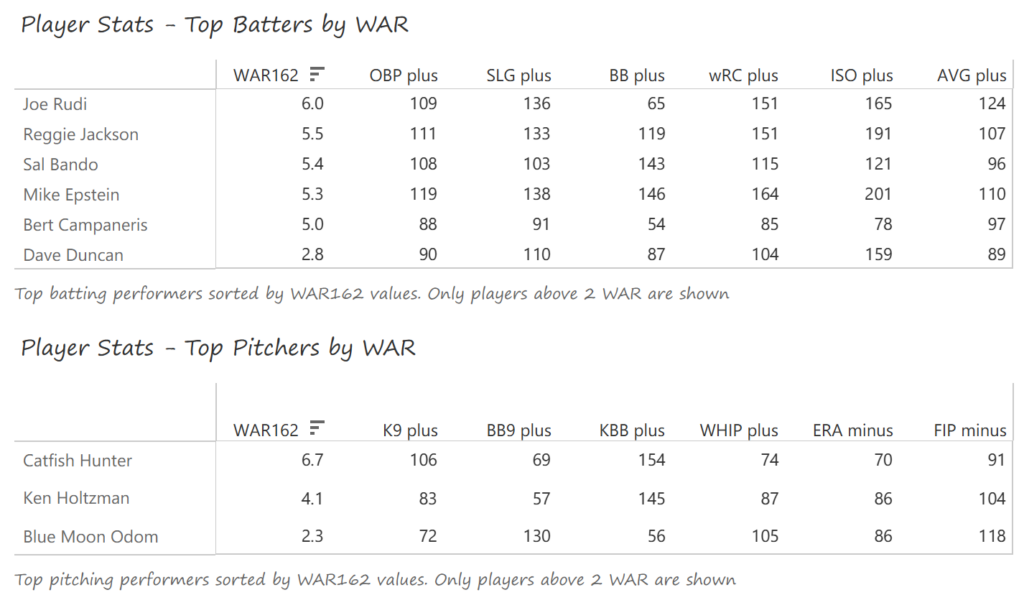
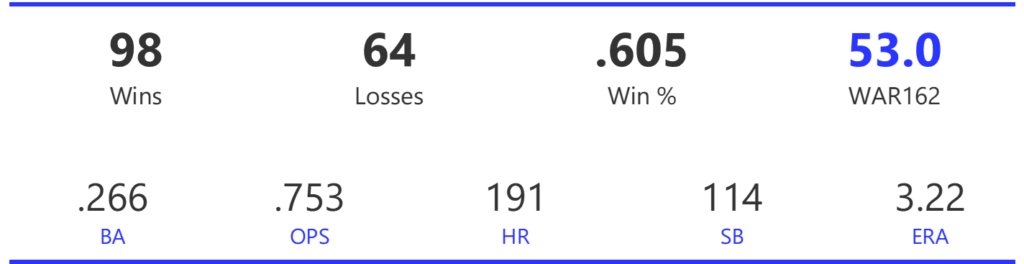
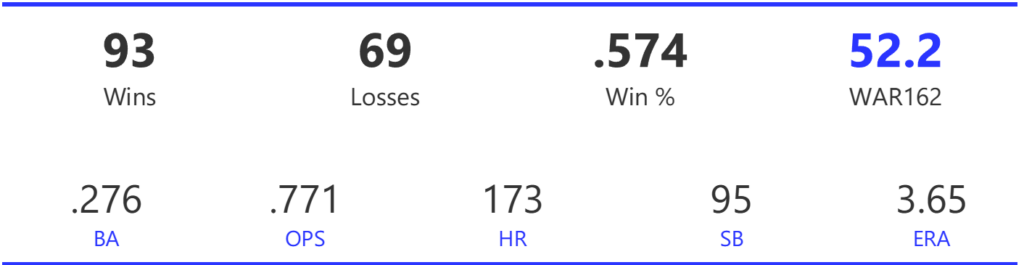
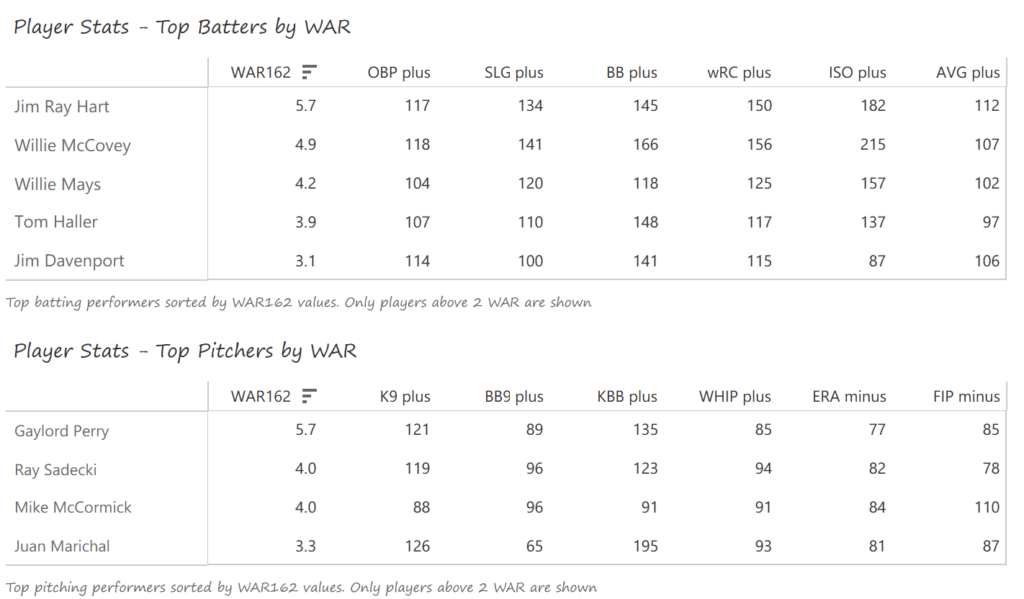
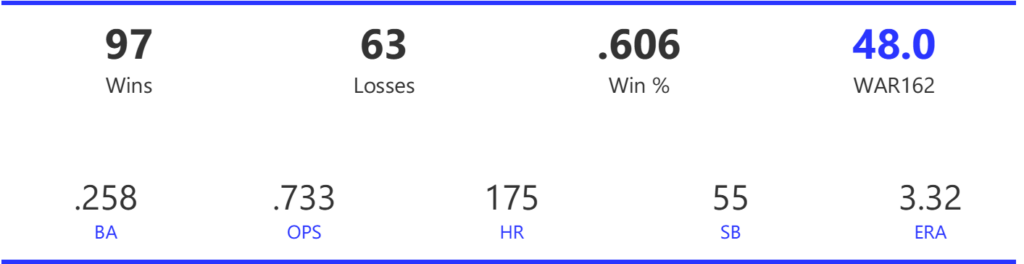
#4: 1976 Cincinnati Reds, 58.5 WAR162
The Reds were back in 1976, once again claiming the NL West title and the NL pennant, before sweeping the Yankees in the World Series.
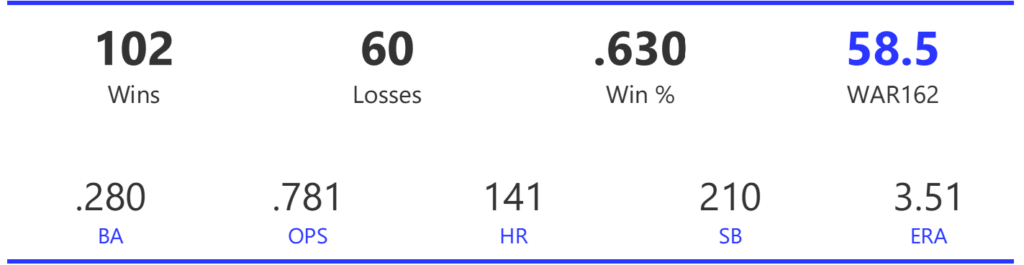
The Reds’ offense was again fearsome, scoring an NL-best 857 runs, 87 more than the Phillies. Their 271 doubles, 63 triples, and 141 homers all topped the NL; they also swept the BA, OBP, SLG, and OPS rankings. Once again, their pitching lacked big-name stars, but was up to the task. The Reds’ staff ranked fifth (out of 12) in both ERA and WHIP.
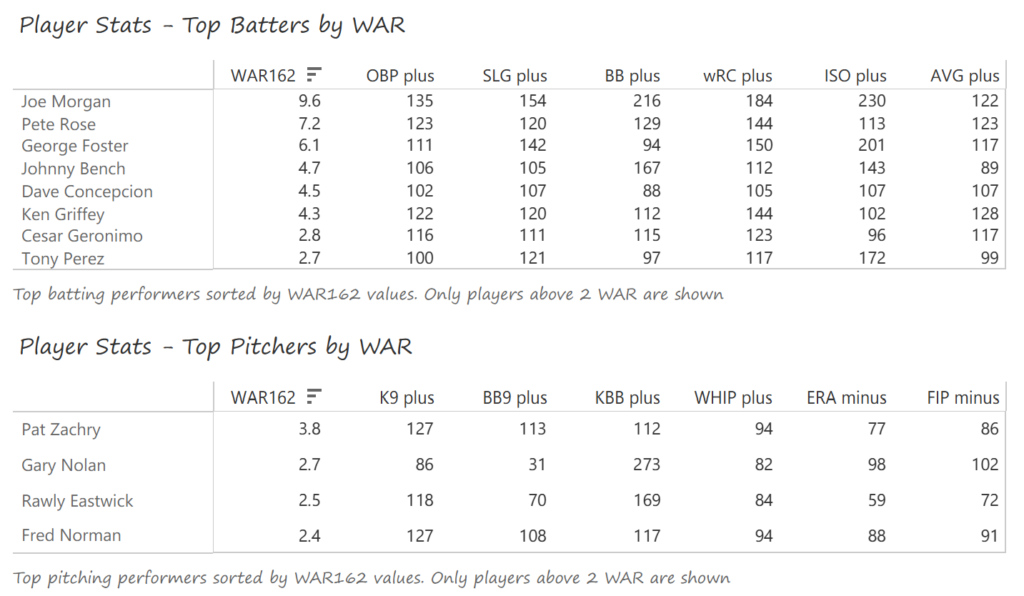
Joe Morgan repeated as the NL MVP, batting .320 and leading the league in OBP, SLG, and OPS. He also stole 60 bases, scored 113 runs, and had 11 RBI, plus another Gold Glove Award. Pete Rose had a fine age-35 season, batting .323 and leading the NL in runs, hits, and doubles. George Foster belted 29 homers, had a .306 BA, and topped the NL with 121 RBI. Johnny Bench’s offensive output dipped from prior seasons, but he still managed 74 RBI, a .348 OBP, and another Gold Glove Award. Dave Concepcion (.281 BA, Gold Glove) and Ken Griffey (.336 BA, 34 steals) added offensive and defensive efficiency to the team. Pat Zachry posted a 14-7 record with a 2.74 ERA to capture NL Rookie of the Year honors, while the rest of the pitching staff was solid rather than spectacular.
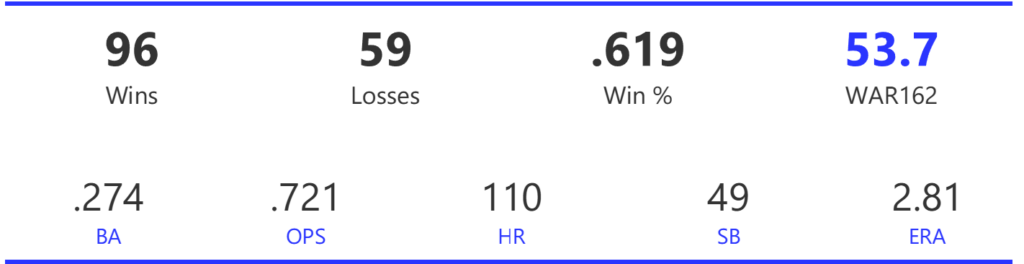
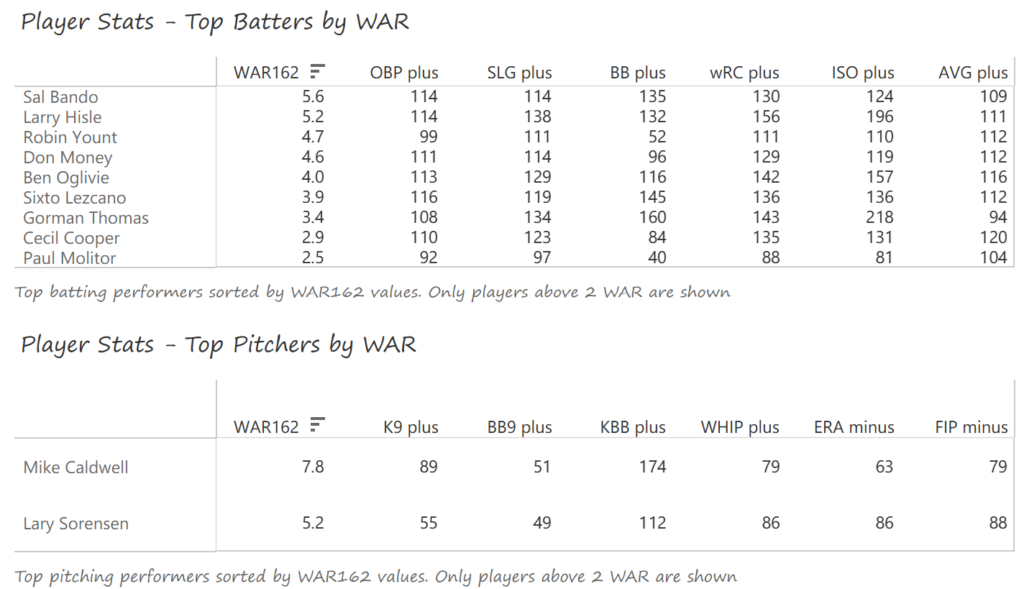
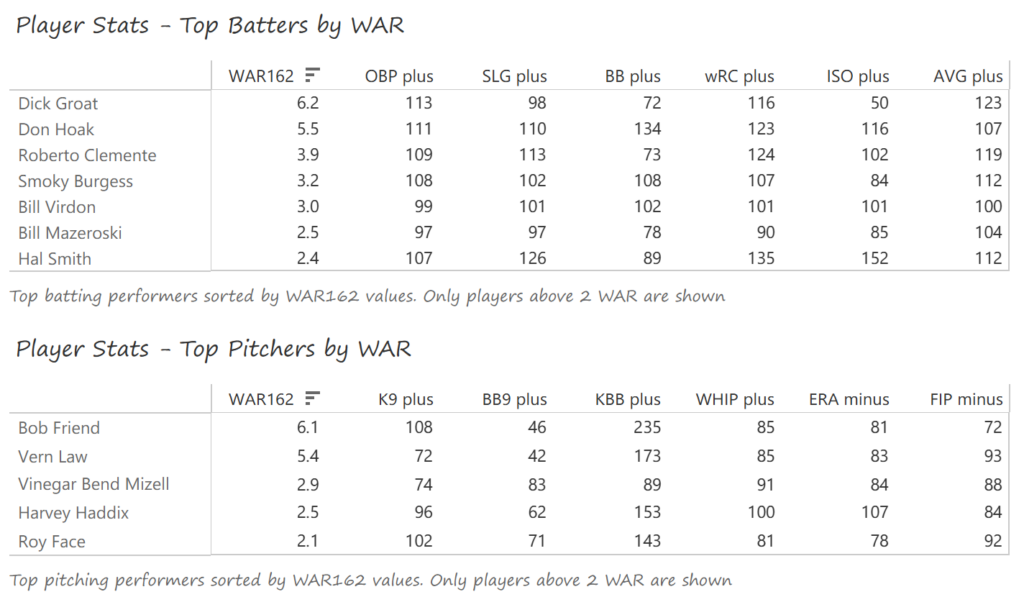
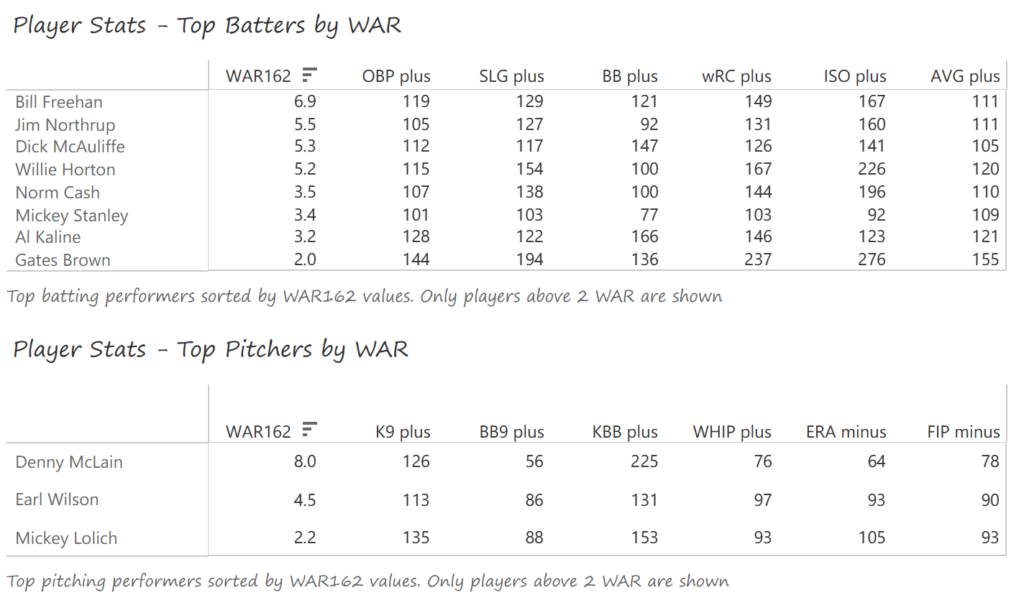
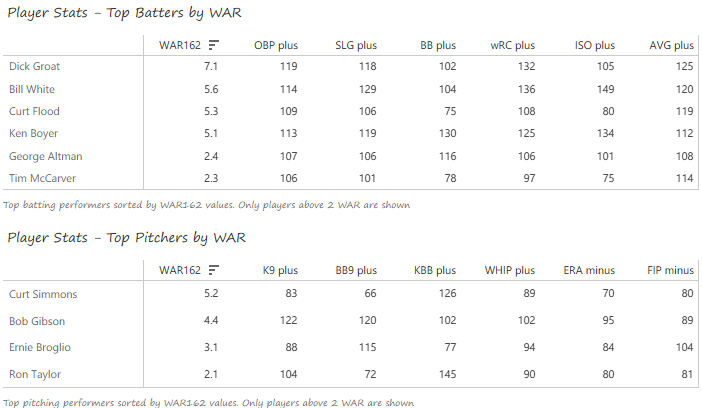
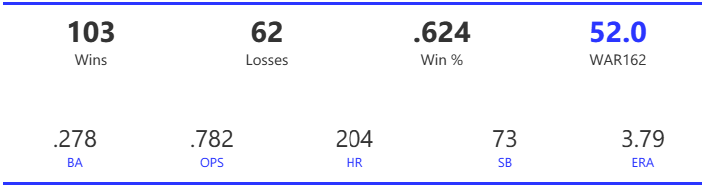
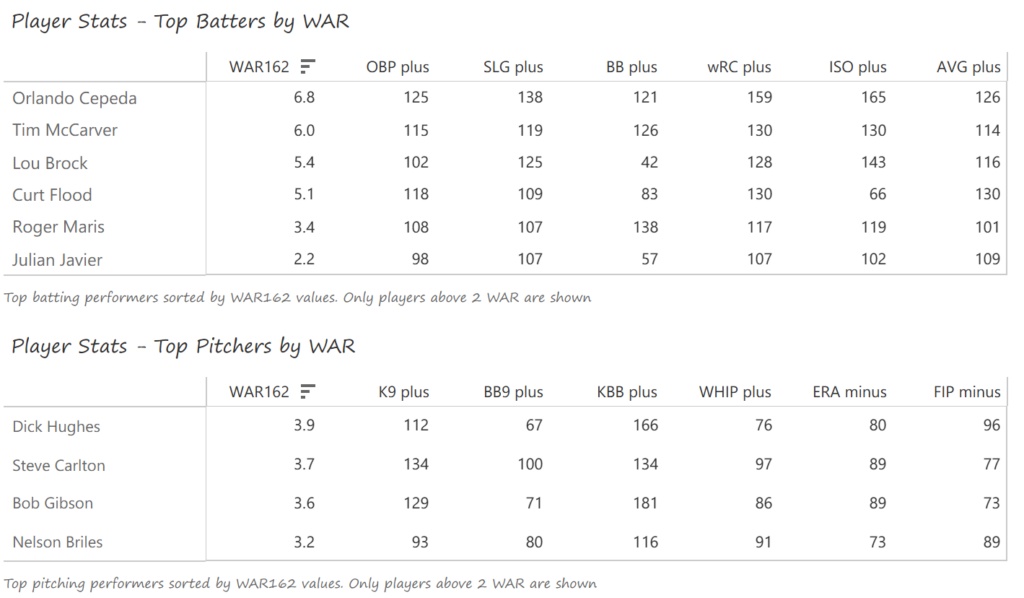
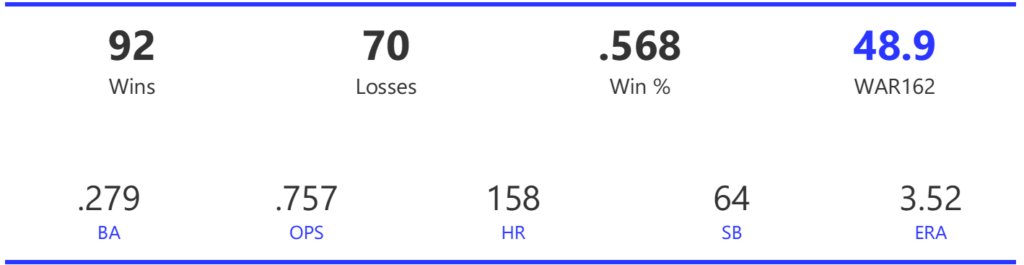
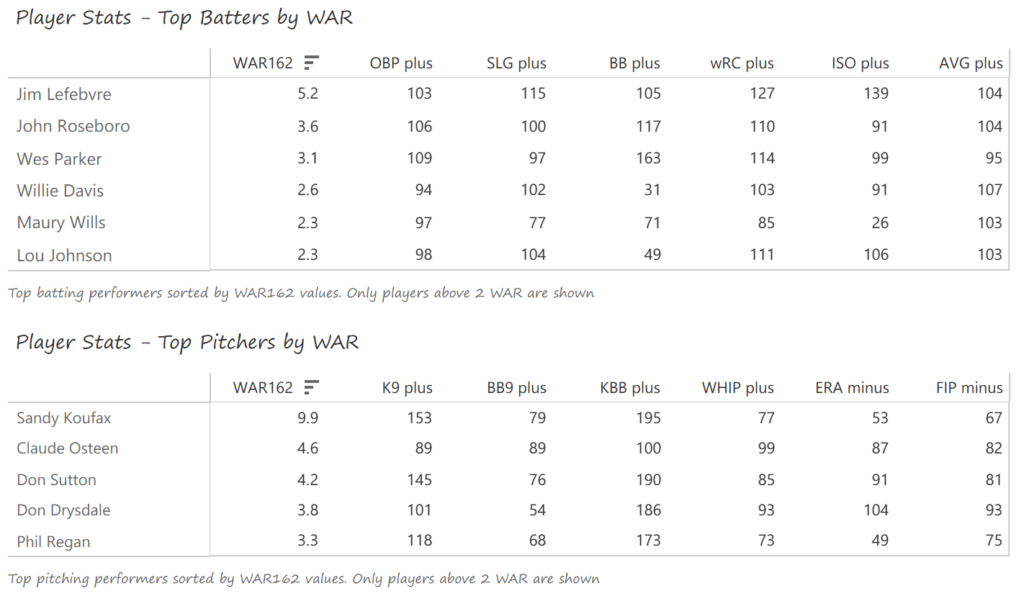
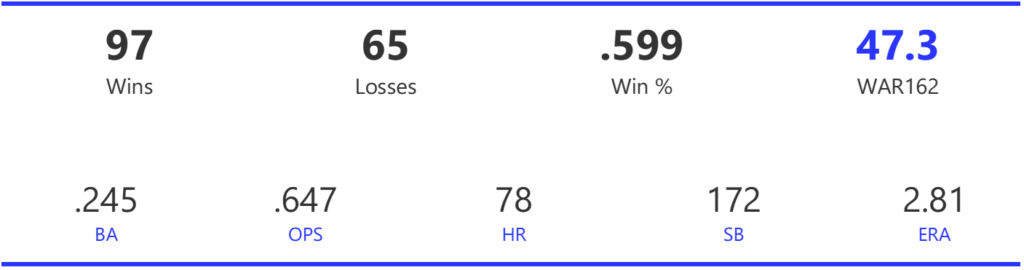
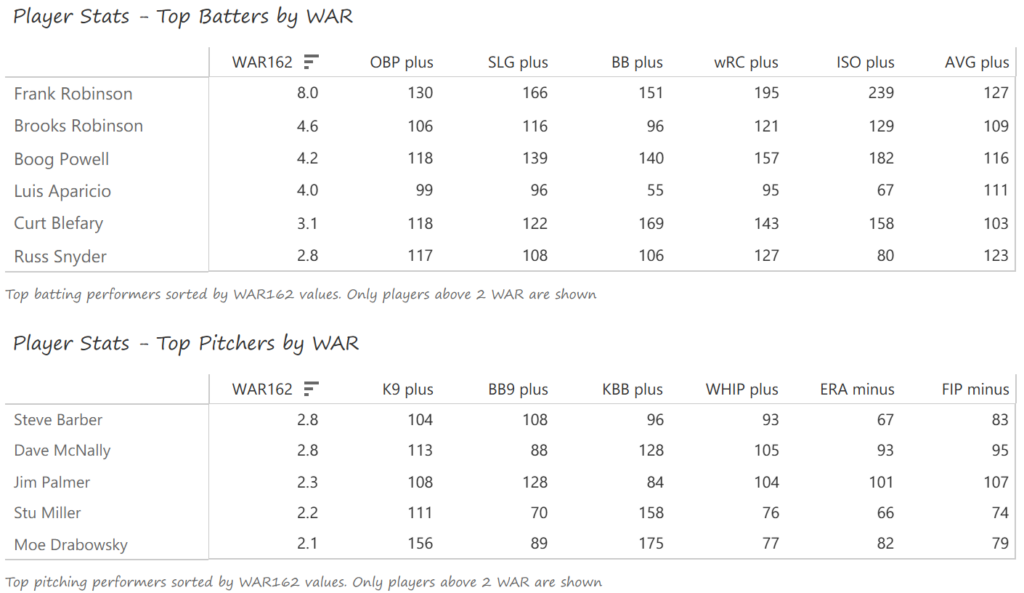
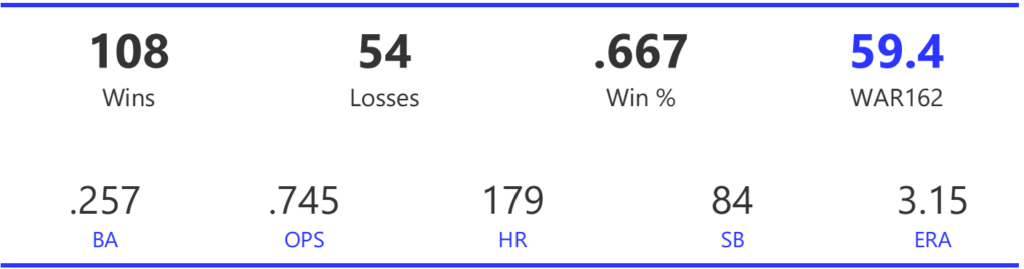
#3: 1971 Baltimore Orioles, 59.3 WAR162
The 1971 Orioles cruised to the AL East title, leaving the Tigers 12 games behind. They then swept the Athletics in the ALCS before falling to the Pirates in a seven-game World Series.
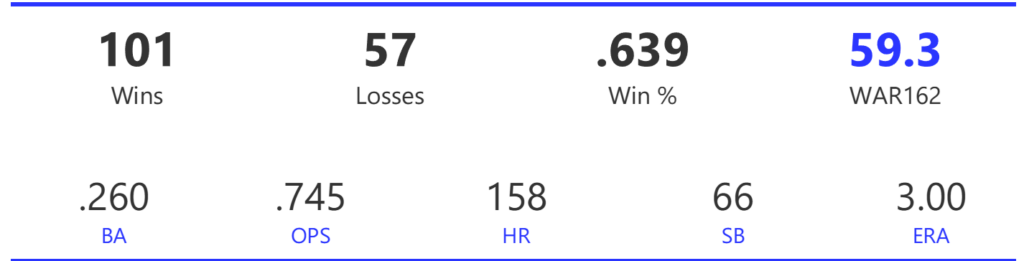
The Orioles topped the AL in BA, OBP, and OPS while scoring a league-leading 742 runs (despite playing four fewer games). They ranked fourth in homers, but only the Tigers hit more per game. Pitching was an Orioles strength in the 1969-73 era, and 1971 was no exception. The Birds led the AL in ERA and placed second in WHIP.
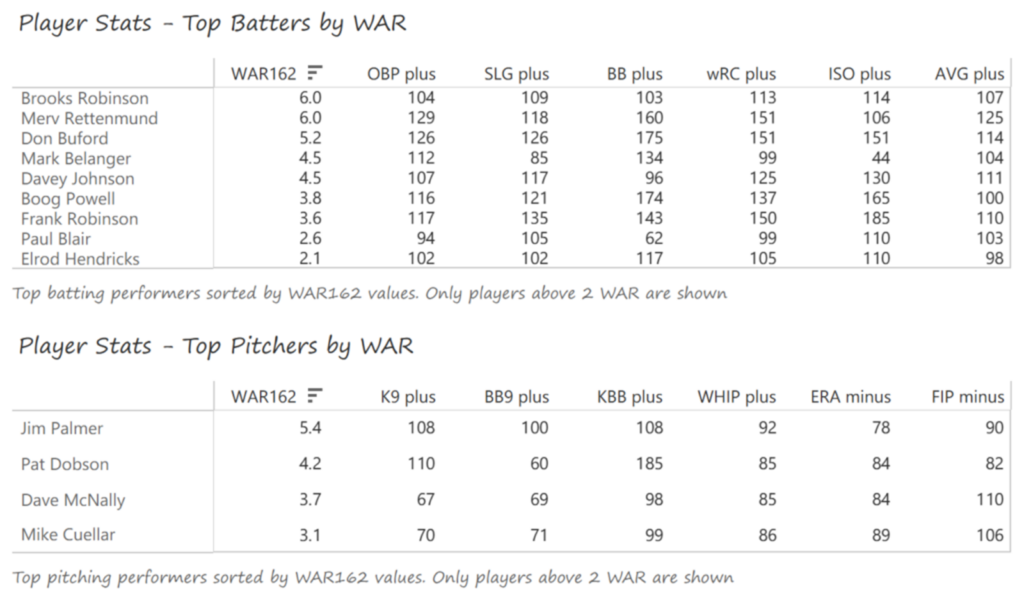
Brooks Robinson (18 homers, 94 RBI, Gold Glove Award) and Merv Rettenmund (.322 BA, 18 home runs in just 385 plate appearances) led the way for the Orioles. Don Buford had another fine season with a .406 OBP and 99 runs scored, and Mark Belanger played his usual exceptional defense at shortstop. Davey Johnson batted .281 and earned a Gold Glove Award at second base, and Boog Powell slugged 35 homers with 114 RBI to claim AL MVP honors. On the mound, the Orioles had four 20-game winners, led by Jim Palmer (20-9, 2.68 ERA), Pat Dobson (20-8, 2.90 ERA), and Dave McNally (21-5, 2.89 ERA). Veteran lefty Mike Cuellar posted a 20-9 mark to complete the dominant starting rotation.
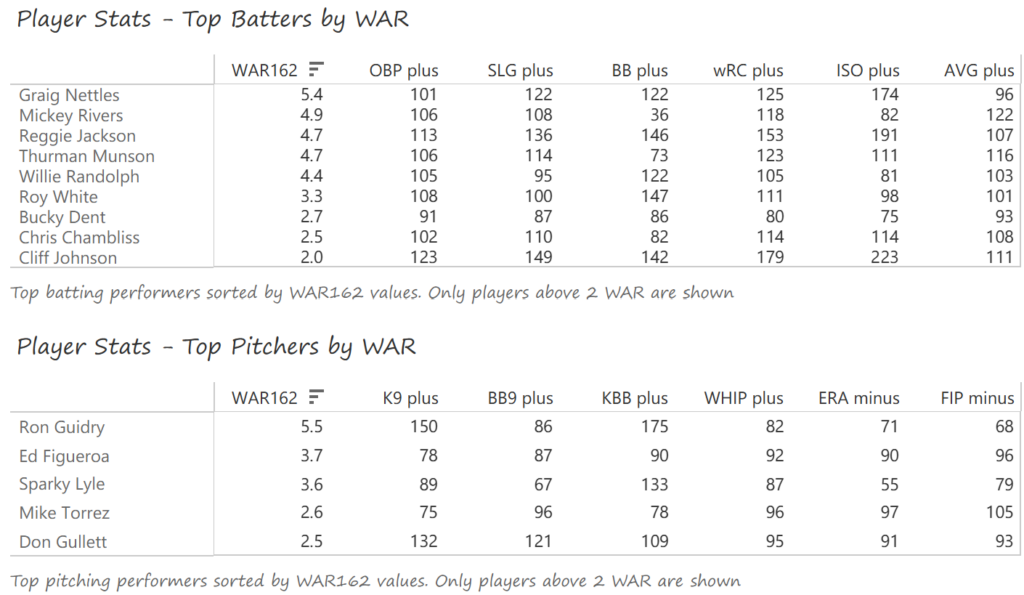
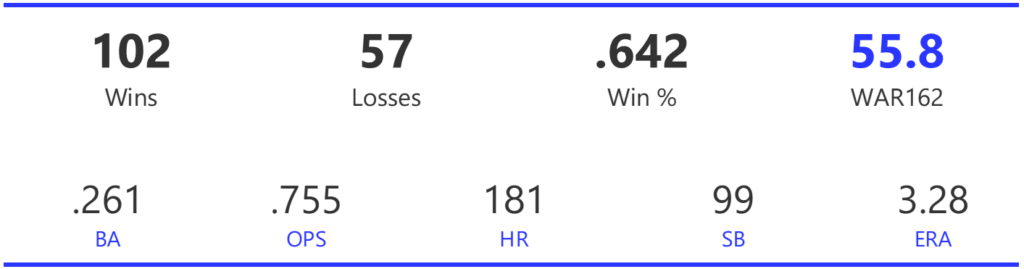
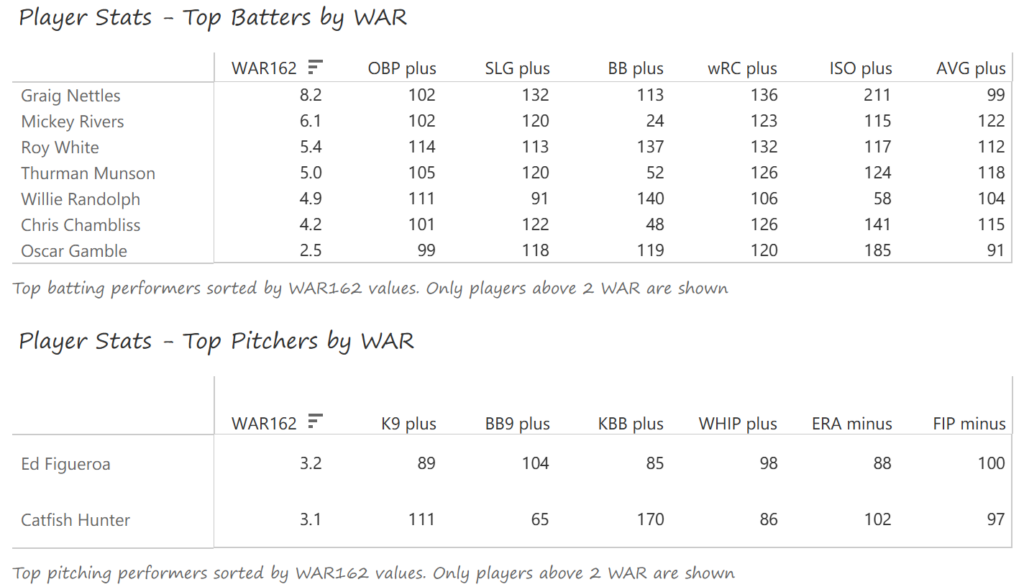
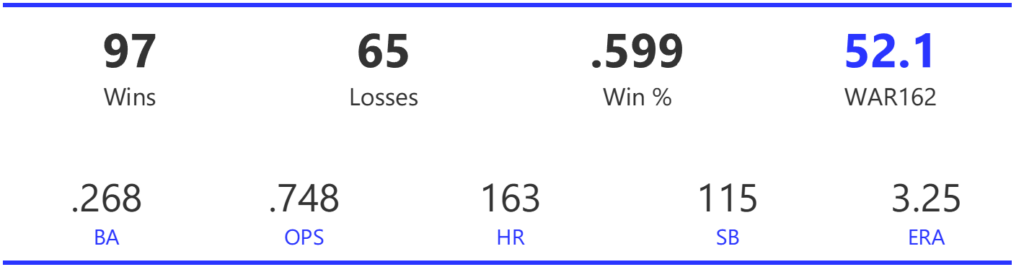
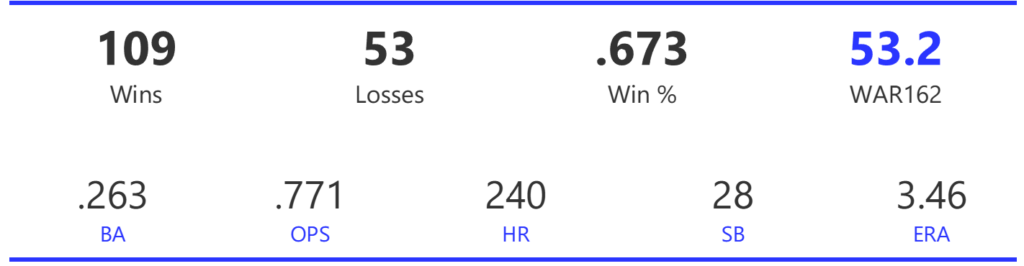
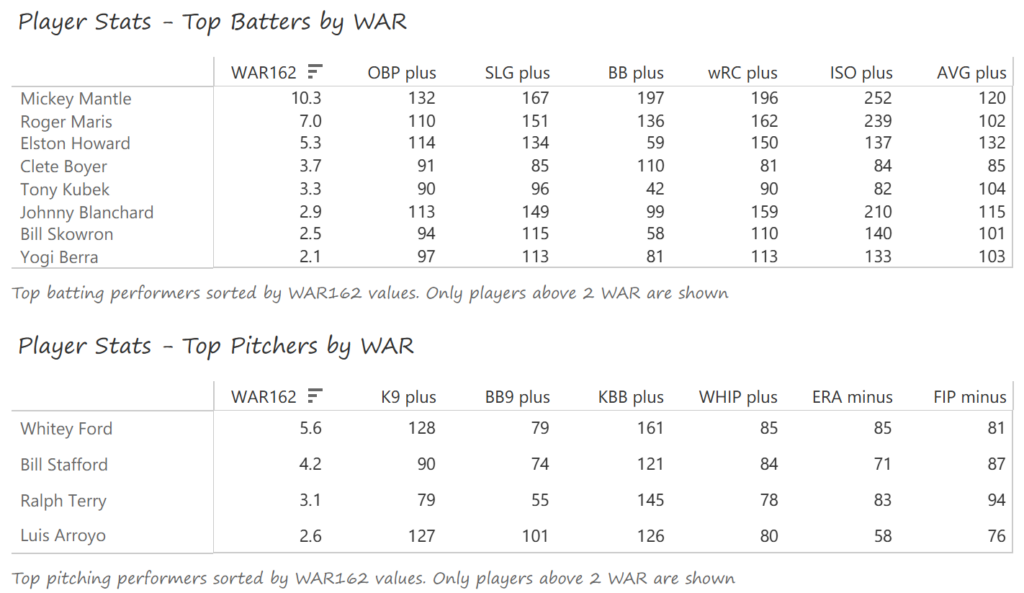
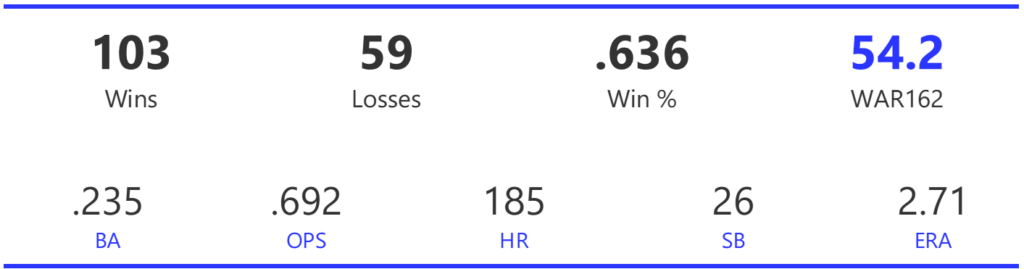
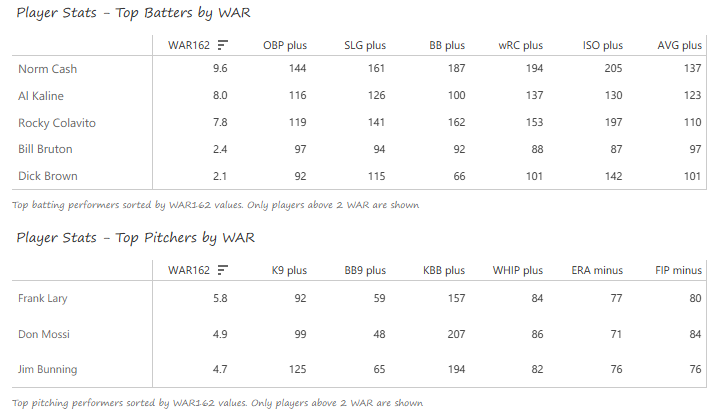
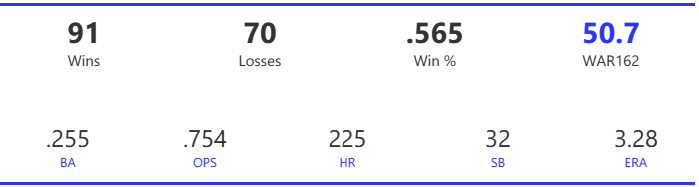
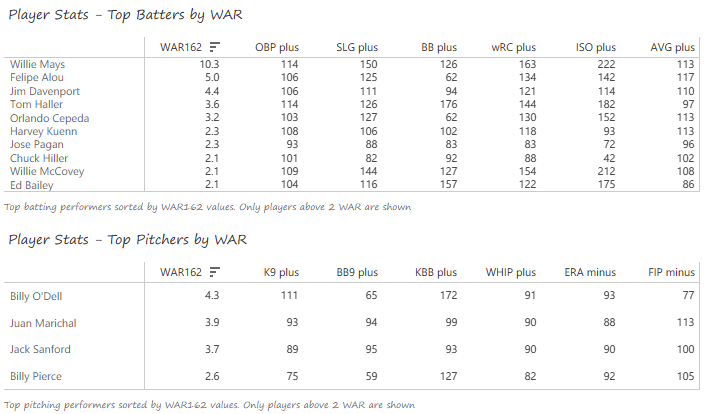
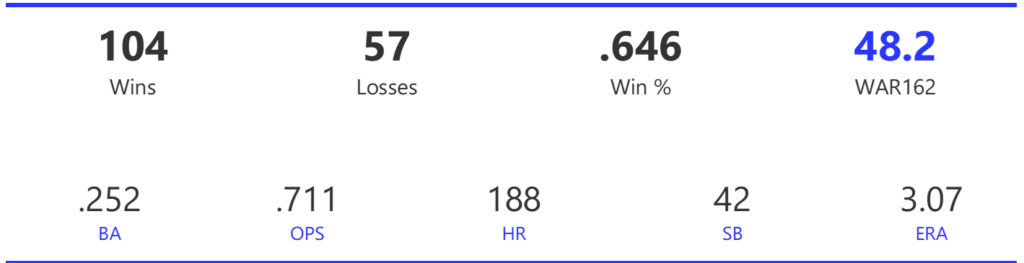
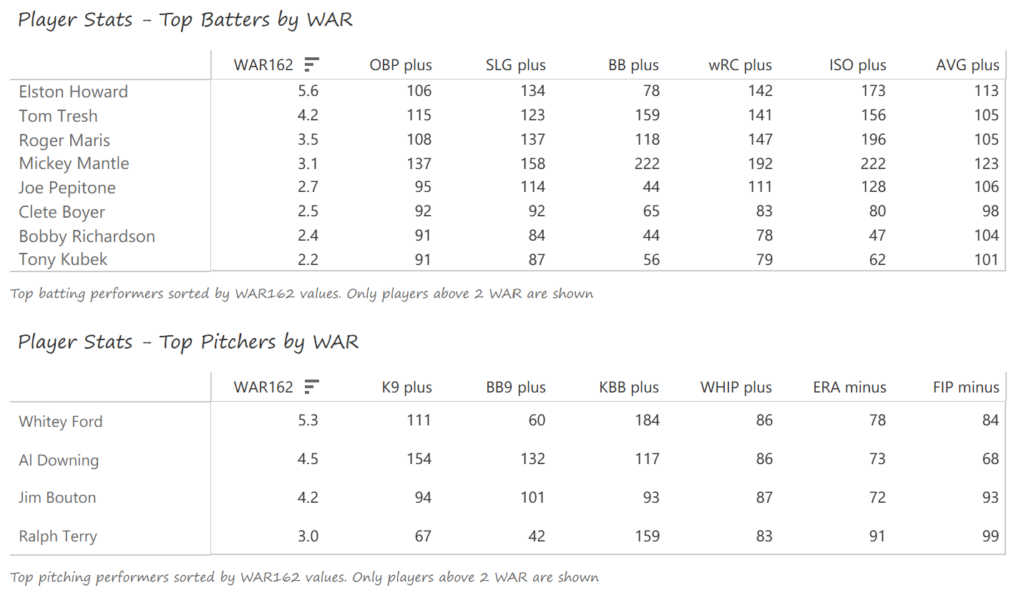
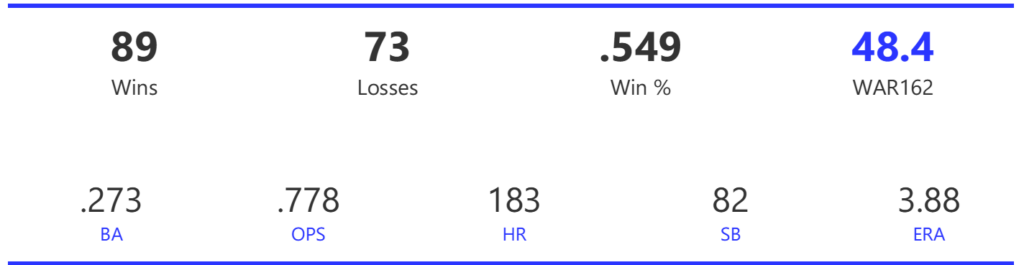
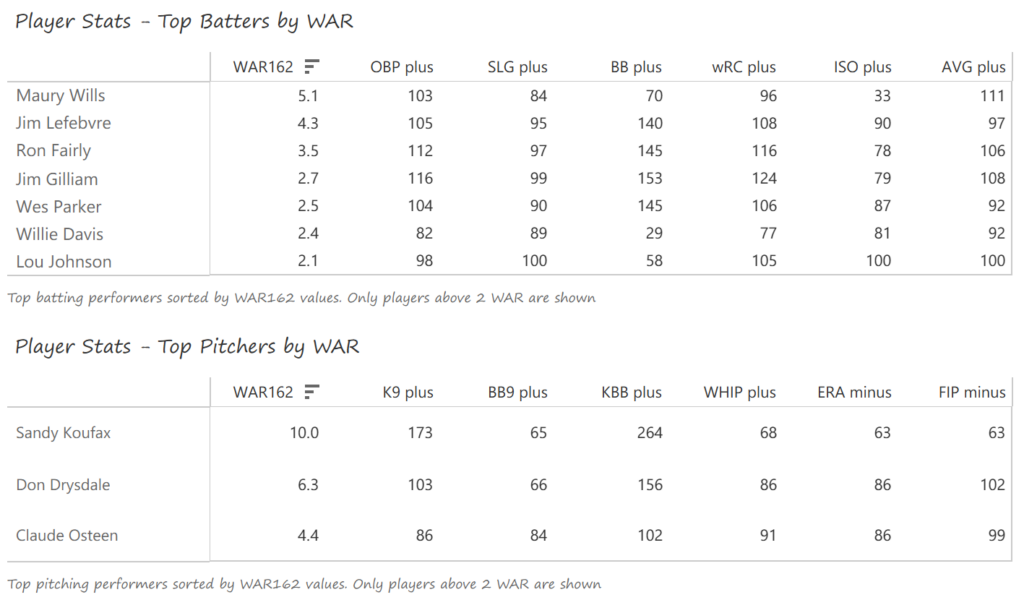
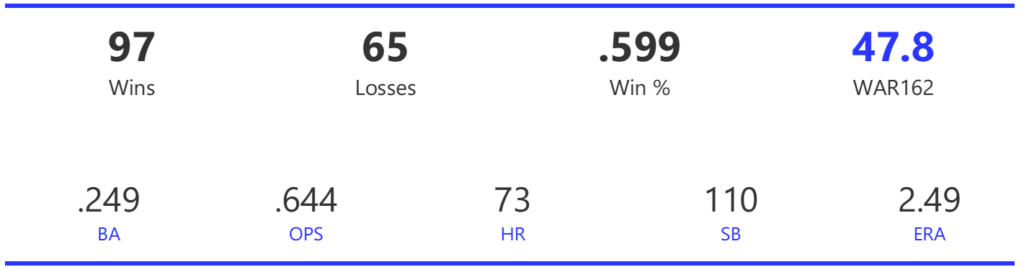
#2: 1970 Baltimore Orioles, 59.4 WAR162
The 1970 Orioles easily won the AL East, finishing 15 games ahead of the Yankees. They then dominated the postseason, sweeping the Twins and the ALCS and beating the Reds in a five-game World Series.
The Orioles featured a potent offense that ranked first in the AL in runs, third in BA, first in OBP, and second in OPS. Their pitching staff led the AL in ERA, WHIP, and strikeout-to-walk rate. This team could win either with offense or by shutting down the opposition.
Paul Blair and Boog Powell led the Orioles in positional WAR162 in 1971, albeit via very different means. Blair batted .262 while playing exceptional Gold Glove defense, and Powell belted 22 homers with 92 RBI and drew 82 walks. Merv Rettenmund batted .318 with 15 steals as a fourth outfielder, while veteran star Frank Robinson had 28 homers and 99 RBI in his age-35 season. Don Buford (.413 OBP, AL-best 99 runs), Brooks Robinson (20 homers, 92 RBI, Gold Glove), and Davey Johnson (.282 BA, Gold Glove) all provided significant offensive and defensive support for the Orioles.
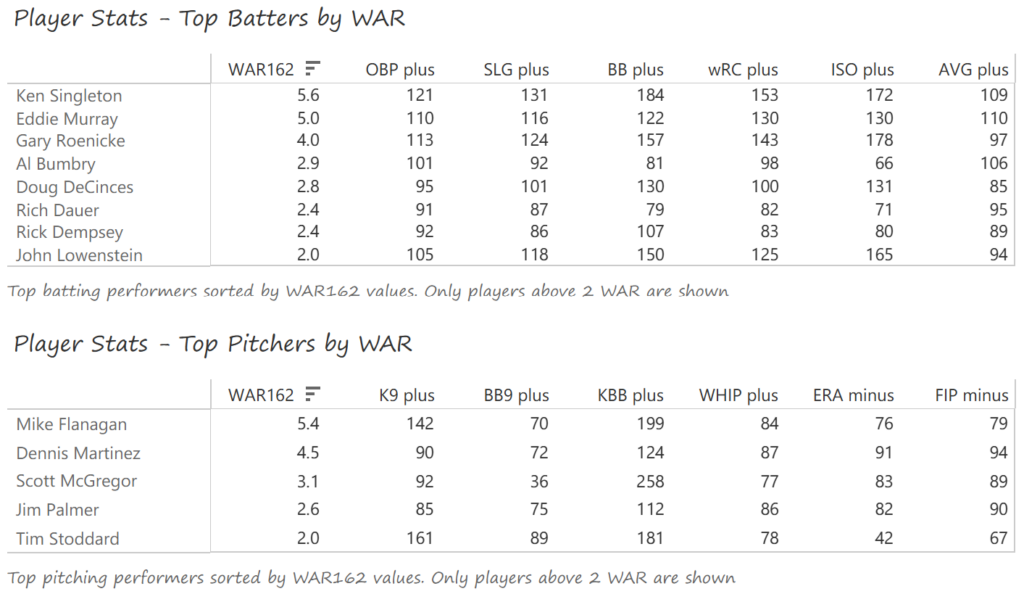
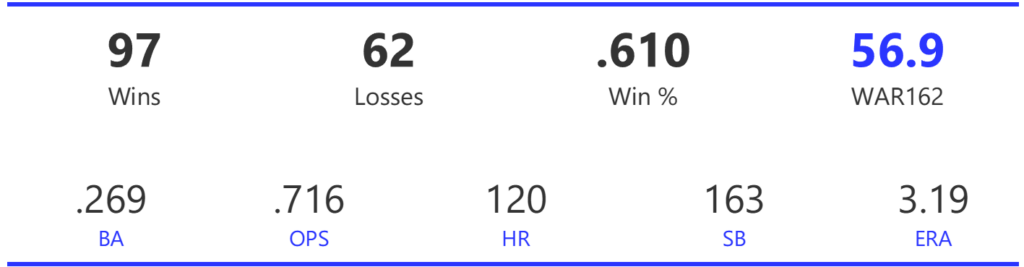
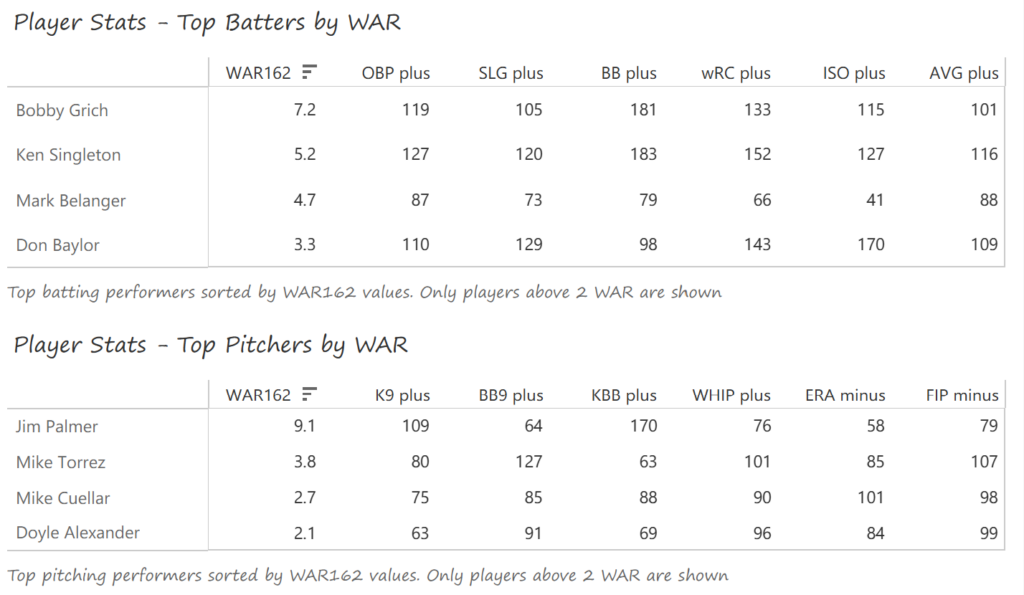
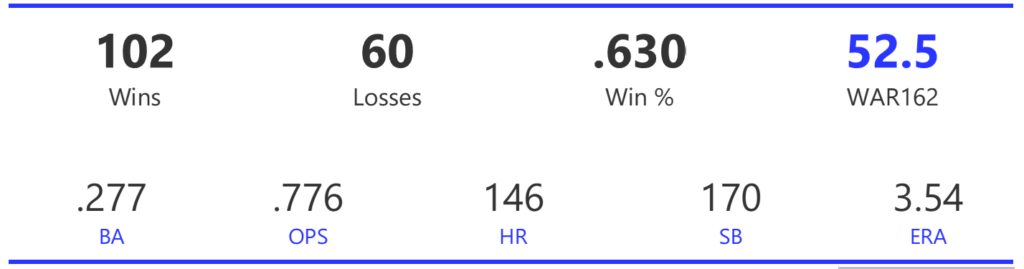
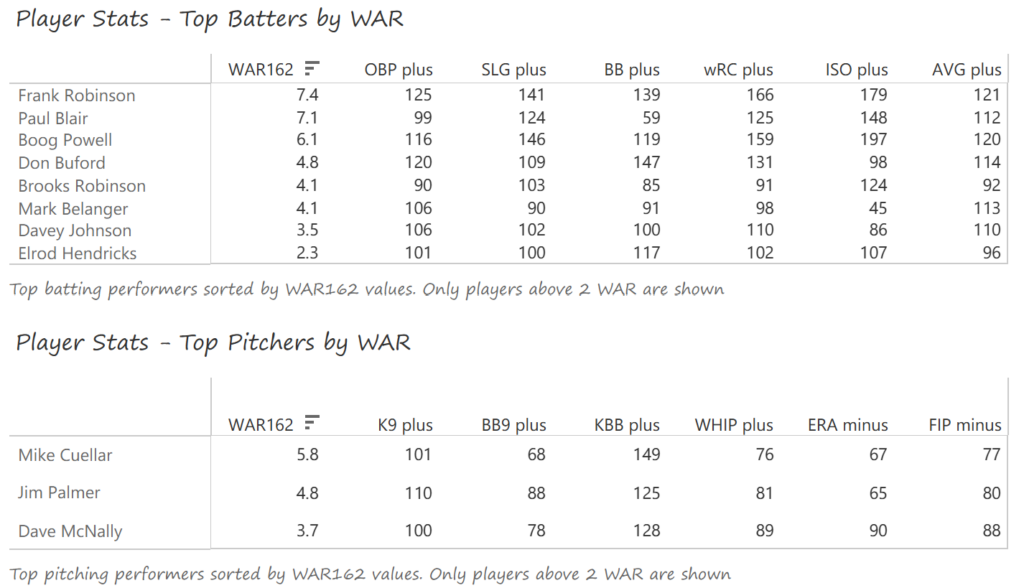
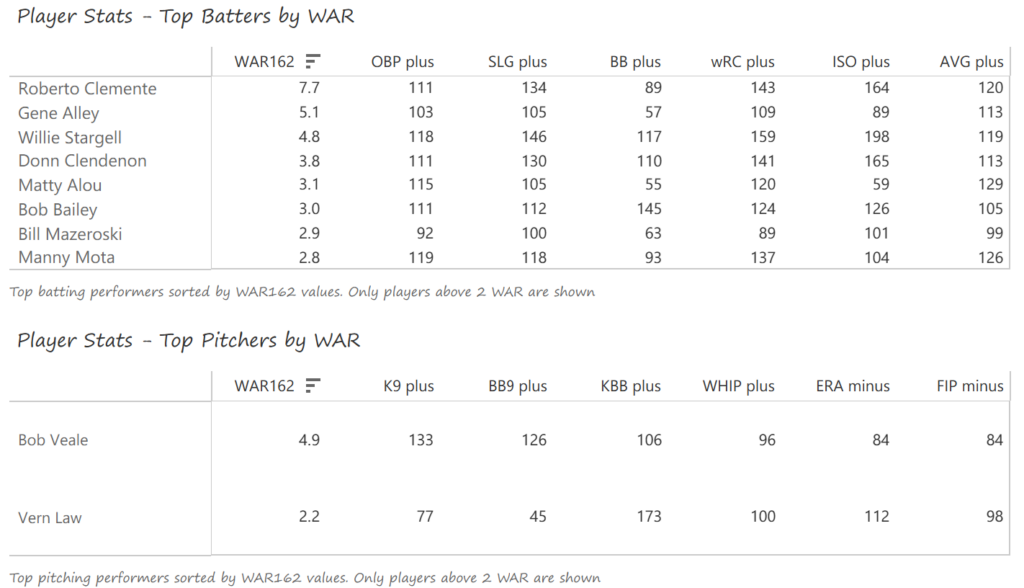
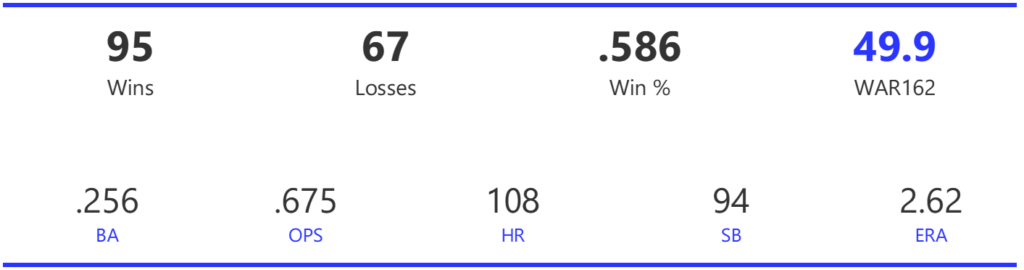
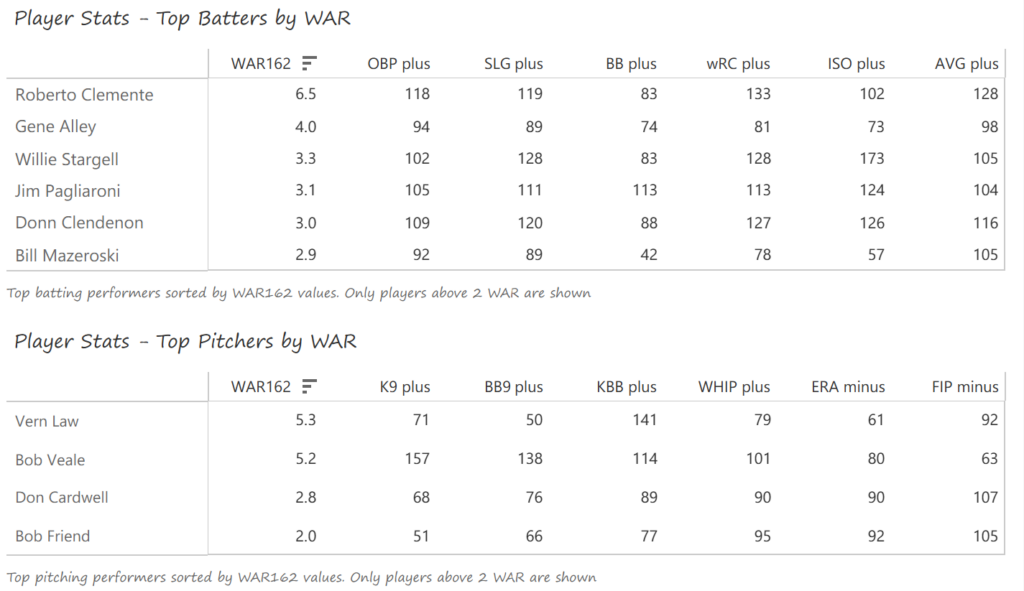
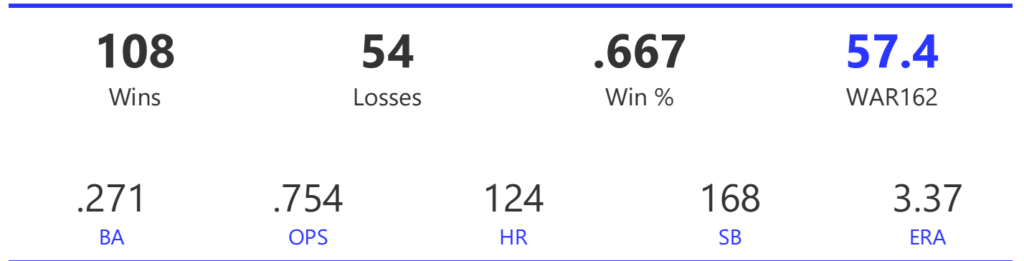
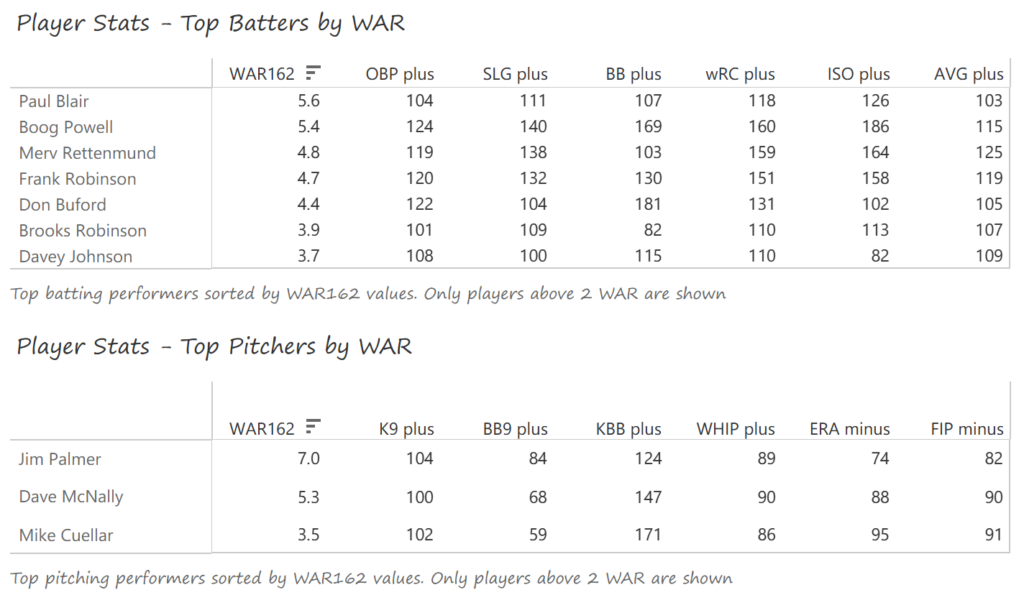
#1: 1973 Baltimore Orioles, 60.2 WAR
The 1973 Orioles claimed their 4th AL East title in 5 years, but were upended by the Athletics in a 5-game ALCS. The Orioles Pythagorean win projection was 102, a full five games better than their actual result.
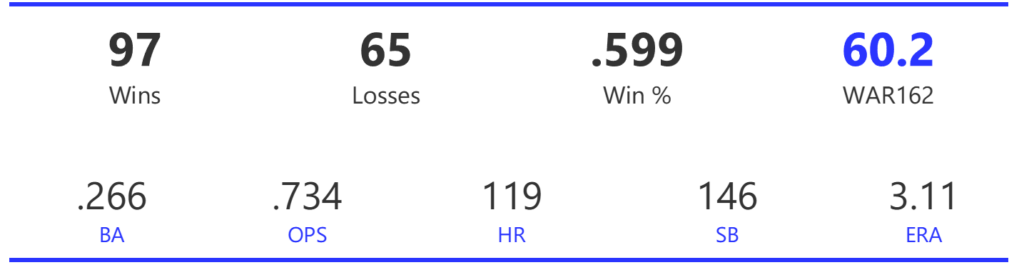
The Orioles again had a diverse offense, albeit one with more speed and less power than in recent years. The O’s 146 steals easily led the AL, while the team ranked third in BA and OPS, and first in OBP. Their 754 runs were just 4 behind the A’s league-leading 758. Pitching remained a strong suit for Baltimore, as its staff topped the AL in ERA and WHIP.
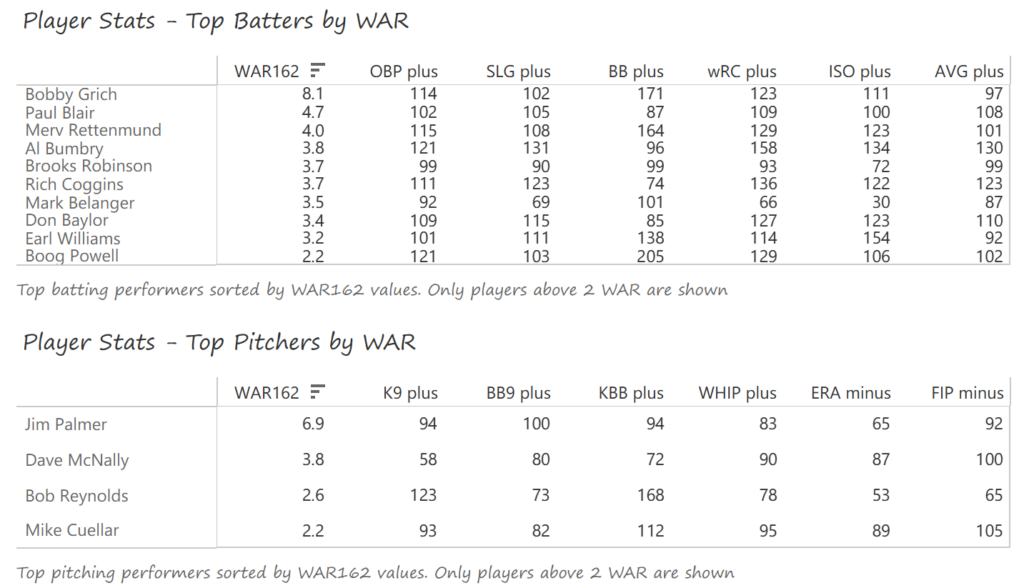
Second baseman Bobby Grich had a career WAR year in 1973, scoring 82 runs, drawing 107 walks, and playing Gold Glove defense. Paul Blair claimed another Gold Glove while batting .280 with 18 steals, and Merv Rettenmund had a .378 OBP and 59 runs scored in 390 plate appearances. Al Bumbry was the AL Rookie of the Year, batting .337 with 23 steals and an AL-best 11 triples. Jim Palmer had another great season on the mound, posting a 22-9 record with a 2.40 ERA in winning the Cy Young Award. Dave McNally won 17 games in support of Palmer.
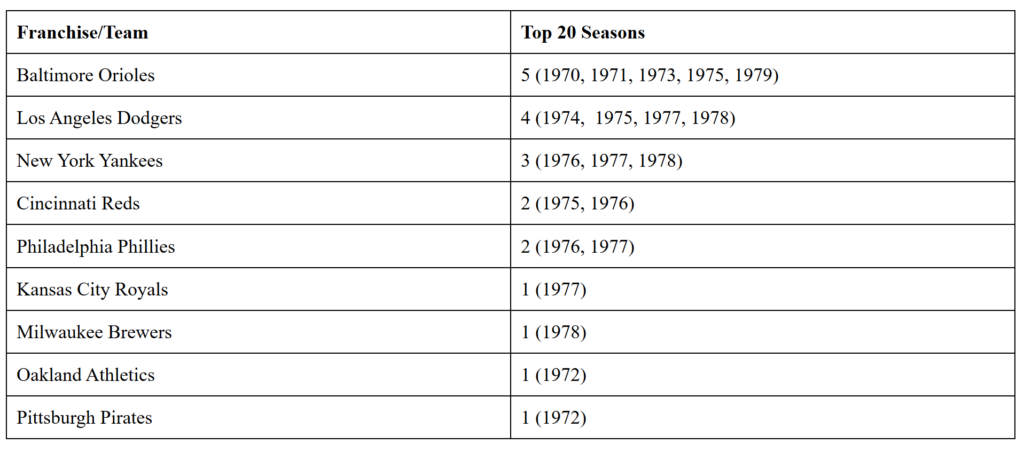
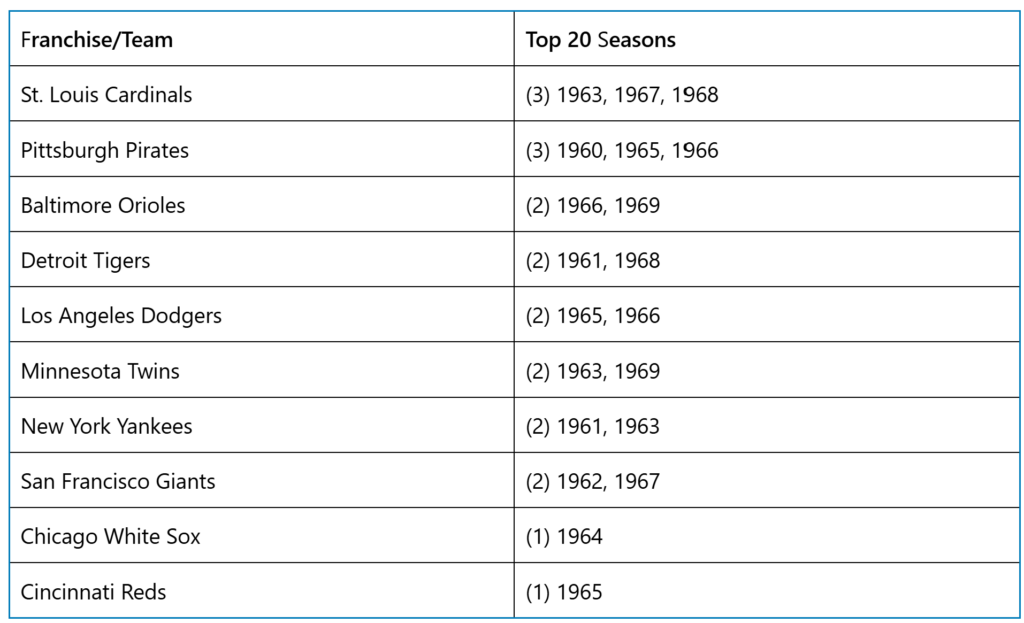
That’s it for the final entry in our MLB Team Rankings for the 1970s decade! Here’s a summary of the most dominant franchises of the 1970s: