Month: August 2026

Cubs Radial Axis Network

Our next entry in the MLB Radial Axis Series features the Cubs, one of the National League teams dating back to 1901. In total, we’re talking about 125 seasons from 1901 through 2025. We’re going to walk through some highlights from the network, and then provide the link so you can explore it in detail. For some background on how the network graphs work, select this link – Anatomy of MLB radial axis graphs.

The Cubs Network

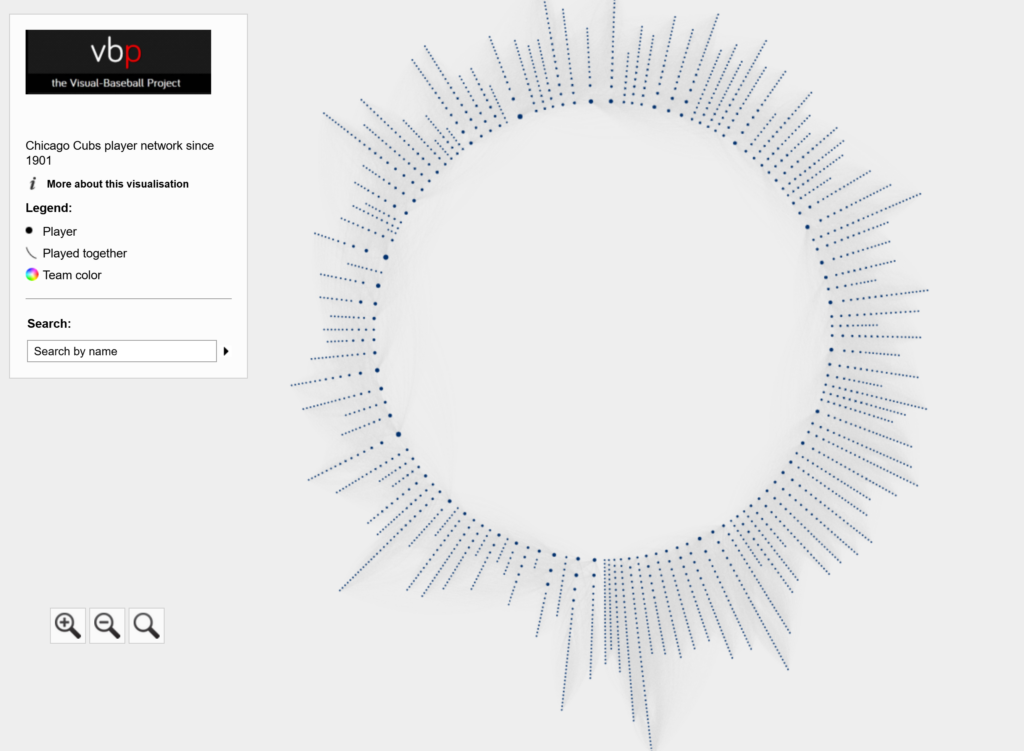
The Cubs’ radial axis network reflects the connections among all players who spent time with the franchise from 1901 to 2025. The 1901 season is found at the bottom center of the graph. Subsequent seasons are arranged clockwise, eventually returning to the bottom center with the 2025 season. Player nodes are sized by the number of seasons spent with the team, and the gray lines between nodes reflect connections to other players. The interactive version of the network is here – Cubs Network.

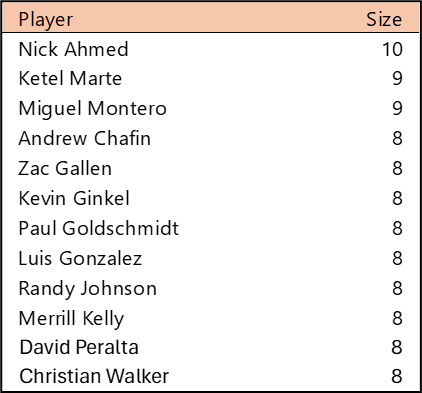
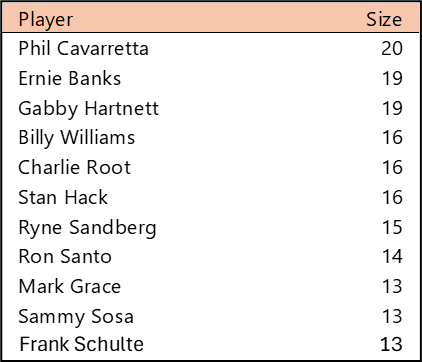
Top 10 by Seasons Played (Size)

Phil Cavaretta (1934-1953) tops the Cubs with 20 seasons played, winning NL MVP honors in 1945 courtesy of a .355 BA. A trio of Hall of Famers follows Cavaretta, led by Mr. Cub, Ernie Banks (1953-1971), and Gabby Hartnett (1922-1940). Banks spent his entire career with the Cubs, while Hartnett played his final season with the Giants. Billy Williams (1959-1974) led the NL with a .333 BA in 1972, before finishing his career with the Athletics. Other Hall of Famers on the list include Ryne Sandberg (1982-1994, 1996-1997) and Ron Santo (1960-1973).

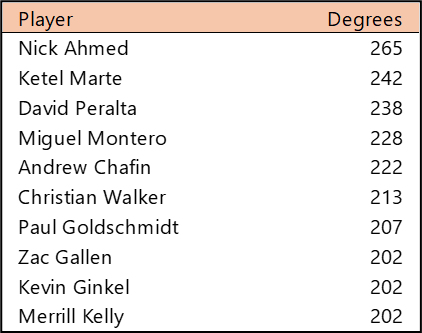
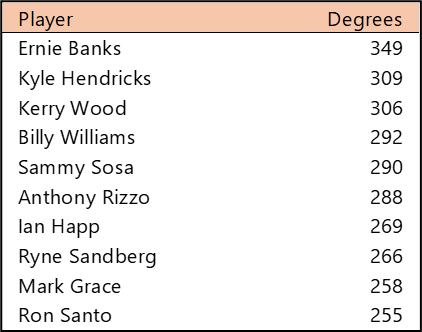
Top 10 by Degree (the number of connections)

Ernie Banks is the runaway leader in the number of connections as a Cub, having rostered with 349 other players. Kyle Hendricks (2014-2024) and Kerry Wood (1998, 2000-2008, 2011-2012) are the only other Cubs with 300+ teammates during their tenure. The remainder of the list includes several players known for their Cubs career, including Billy Williams, Sammy Sosa (1992-2004), Anthony Rizzo (2012-2021), Ryne Sandberg, Mark Grace (1988-2000), and Ron Santo.

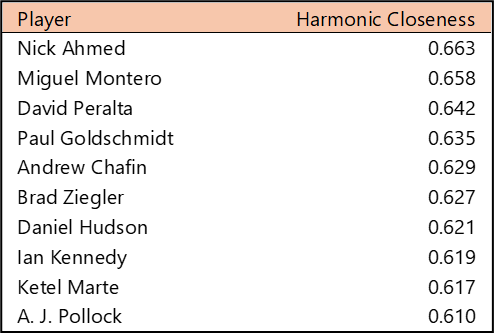
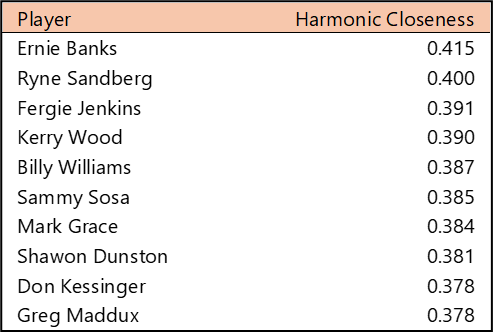
Top 10 by Harmonic Closeness Centrality

With Harmonic Closeness Centrality, we measure how closely an individual player is related to all other players in the network. This number (scaled from 0 to 1) often indicates a player’s importance to the network and may also note that they played with influential teammates. Ernie Banks and Ryne Sandberg top the list, followed closely by star pitcher Fergie Jenkins (1966-1973, 1982-1983). New players appearing in the list include Shawon Dunston (1985-1995, 1997), Don Kessinger (1964-1975), and pitching ace Greg Maddux (1986-1992, 2004-2006).

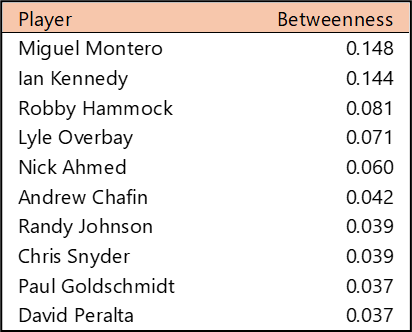
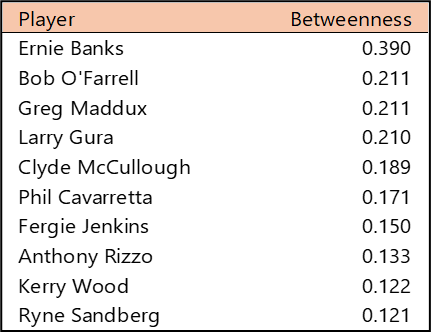
Top 10 by Betweenness Centrality

Betweenness Centrality measures which players rank highest in their ability to connect all other players. In simple terms, which player provides the most efficient path through the network (scaled from 0 to 1). Ernie Banks is the clear leader here; Mr. Cub provides the most efficient path through the network. Bob O’Farrell (1915-1925, 1934) is a strong connector for an earlier era of Cubs players, while Greg Maddux scores highly due to his separate Cubs tenures. Larry Gura (1970-1973, 1985) is another player who provides an efficient path despite playing less than five full seasons as a Cub. He and Maddux each wound up with two very different sets of teammates based on their early or late career stints.

Summary

That’s it for our overview of the Cubs network. Be sure to visit the interactive graph to discover additional insights about the Cubs players over the last 125 seasons. We’ll be back shortly with our next franchise entry. Thanks for reading!
2000s MLB Team Rankings Countdown: 15 through 11

Welcome to the second countdown post in our series of MLB team rankings for the 2000s. As a reminder, the teams are ranked from #20 through #1 based on aggregate WAR162. The 2000s (for the first time since the 1950s) saw no teams added through expansion. For the decade (2000-2009), a total of 300 team-seasons were eligible, so the top 20 teams are a rather exclusive group – the top 7% for the decade. We’ll summarize each team and include portions of their team dashboard. Then we’ll explain how they attained their ranking. So, without further ado, here are the teams ranked #15 through #11.

Here’s the interactive dashboard at Tableau Public: 2000s Top 20 MLB Teams Dashboard

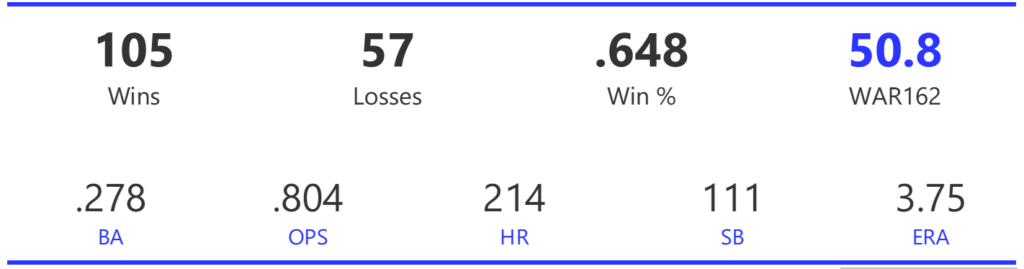
The Cardinals rode a powerful offense to win the NL Central by a resounding 13 games over the Astros. They then took care of business in the playoffs, taking out the Dodgers in a 4-game NLDS, and defeating the Astros in 7 games in the NLCS. Their ride came to an abrupt end with a sweep at the hands of the Red Sox.

The Cardinals’ offense scored 855 runs to top the NL, and ranked second in doubles and third in home runs for the season. They also topped the league in BA and OPS, and ranked second in stolen bases. St. Louis also featured a balanced pitching staff that placed second in ERA while topping the NL in WHIP by a wide margin.

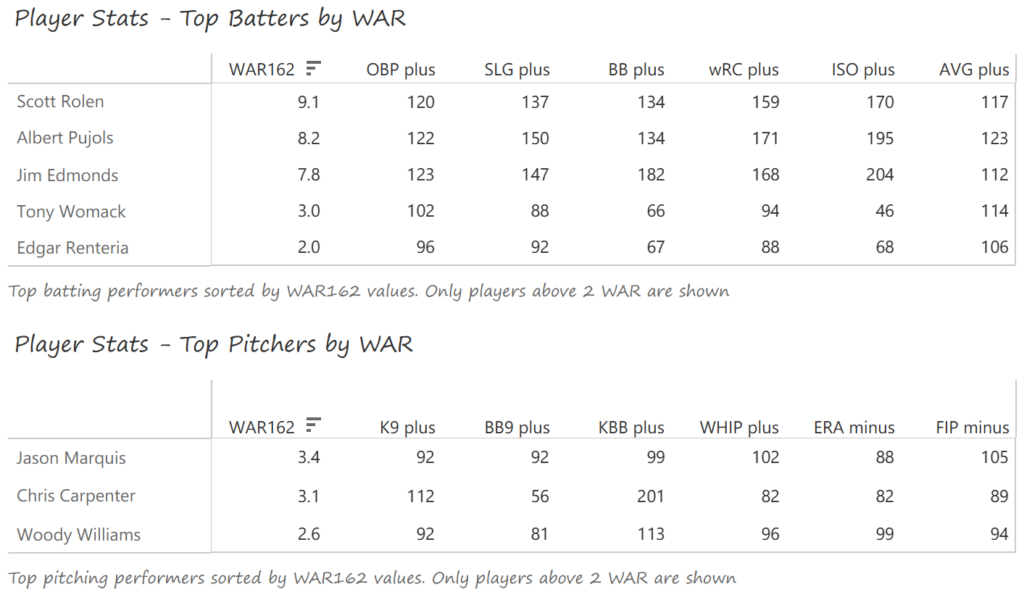
Third baseman Scott Rolen had an outstanding season, batting .314 with 34 homers and 124 RBI. Rolen also earned a Gold Glove for his superb defense at the hot corner. Albert Pujols batted .331with 46 homers and 123 RBI, and led the NL with 133 runs scored. Center fielder Jim Edmonds also starred for the Cards, racking up 42 homers, 111 RBI, and a .418 OBP. Edmonds also claimed a Gold Glove. Tony Womack batted .307 with 26 steals in support of the big three. The Cardinals pitching was consistent if unspectacular, led by Jason Marquis (15-7, 3.71 ERA) and Chris Carpenter (15-5, 3.46 ERA).

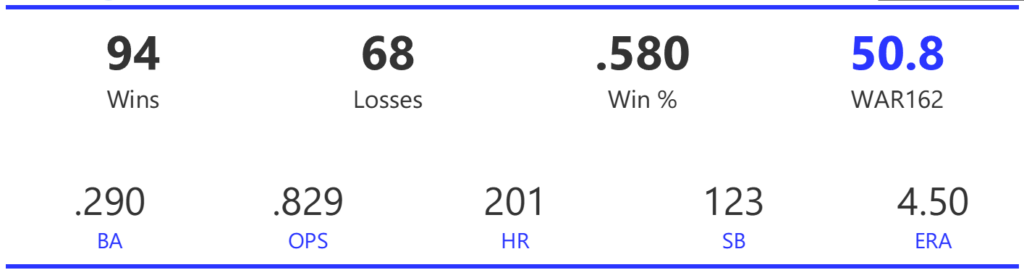
The Yankees finished the regular season two games behind the rival Red Sox, before being defeated by the Indians in a 4-game ALDS.

The Yankees had plenty of offensive firepower, easily outscoring all AL rivals with 968 runs. The New Yorkers also belted an AL-best 201 homers, while sweeping the BA, OBP, SLG, and OPS categories. Pitching was a different story, as the Yanks were a league-average staff in ERA, ranking 8th out of 14 teams. Their WHIP was even further back at 9th in the AL, and the staff fared little better in other key metrics.

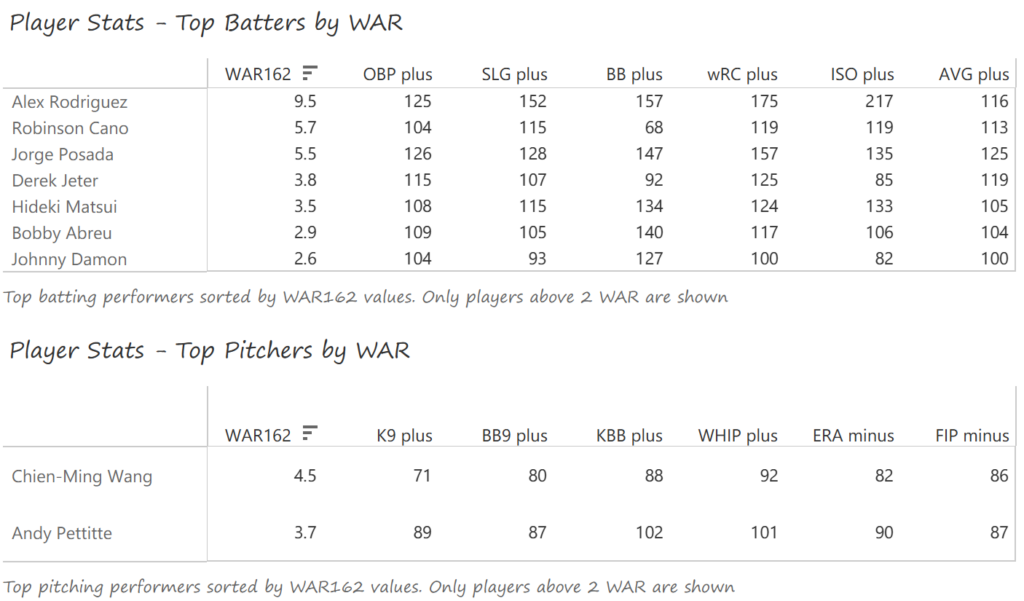
Alex Rodriguez had a monster season for the Yankees, winning AL MVP honors with 54 homers, 156 RBI, 143 runs, and a 1.067 OPS, all tops in the league. Robinson Cano batted .306, and Jorge Posada batted .338 with 20 home runs in his age-36 season. Derek Jeter (.322 BA) and Hideki Matsui (25 homers, 103 RBI) added further offensive punch. Chien-Ming Wang (19-7, AL-best 0.4 HR per 9 innings) and Andy Pettitte (15-9) were the pitching mainstays for the Yankees.

The 2003 Mariners weren’t at the same level as their epic 2001 squad, but were still a potent team. Unfortunately, they finished three games behind the Athletics in the AL West and two games back of the Red Sox in the wild-card race.

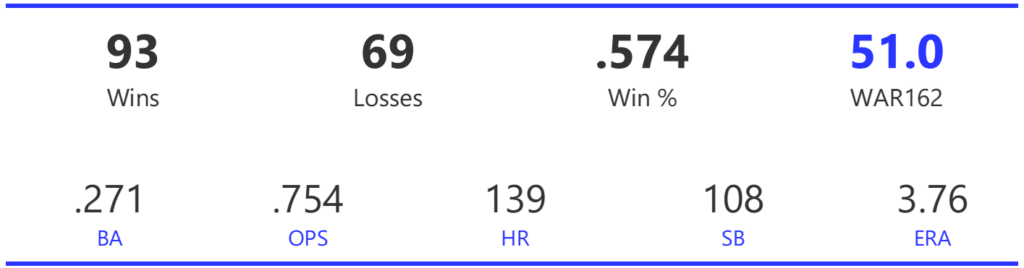
The Mariners’ offense was quite ordinary in 2003, with a 7th-place ranking in runs scored and a meager 139 home runs, the second-fewest in the AL. The team ranked fifth in BA and fourth in both OBP and stolen bases, but this was a fairly modest offense. Pitching carried the club, as the Seattle staff ranked first in WHIP and second in ERA despite a lack of bog-name talent. They also topped the league with 15 shutouts on the season.

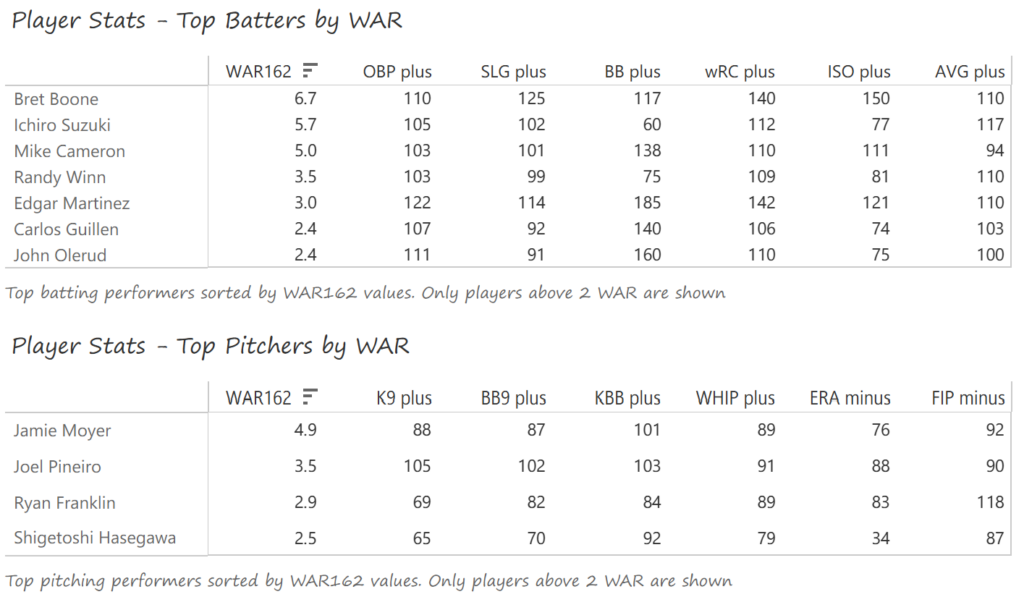
Bret Boone, Ichiro Suzuki, and Mike Cameron led the Mariners position players in 2003. Each of the three earned Gold Glove awards, with Boone adding power to the mix (35 homers, 117 RBI). Ichiro batted .312 with 34 steals and 111 runs scored, and Cameron added 18 homers with a .344 OBP. On the mound, 40-year-old Jamie Moyer posted a 21-7 record with a 3.27 ERA, aided by the great defense behind him. Joel Pineiro added 16 wins, Ryan Franklin another 11, and Shigetosi Hasegawa posted a sterling 1.48 ERA across 73 innings.

The Red Sox had a fine season but finished 10.5 games behind a powerful Yankees team and 6 games back of the wild-card Angels, who ultimately won the 2002 World Series.

The Sox had a strong offense, scoring 859 runs, second only to the Yankees’ 897. Their BA ranked second behind the Angels, and they placed third in both OBP and OPS. On the pitching front, the Sox staff had the top WHIP by a substantial margin, while ranking third in ERA. They also topped the AL in strikeouts and finished second with 17 shutouts on the season.

Nomar Garciaparra and Manny Ramirez led the offense for the Sox, aided by Johnny Damon. Garciaparra topped the league with 56 doubles, adding 24 homers, 120 RBI, and 101 runs scored. Ramirez led the league with a .349 BA and .450 OBP while swatting 33 home runs. Damon added 11 triples, 31 steals, and 118 runs scored. The pitching staff was anchored by Pedro Martinez (20-4, AL-best 2.26 ERA and 249 strikeouts) and Derek Lowe (21-8, 2.58 ERA). Tim Wakefield added 11 wins, splitting duty between the bullpen and starting.

The 2003 Sox wound up in a similar spot as their 2002 brethren, although they reached the AL playoffs as a wild-card entry. They eventually dropped a heartbreaking 7-game ALCS series to the rival Yankees, continuing their 80+ year run without a World Series title.

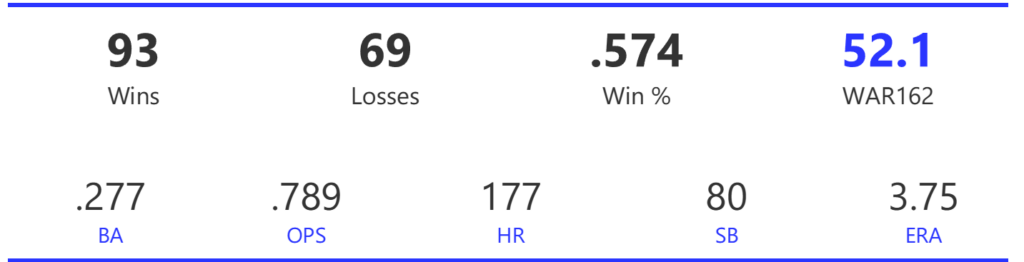
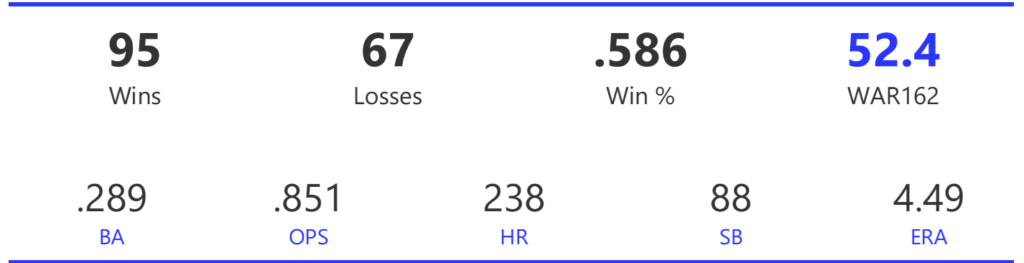
The Sox’s 961 runs easily topped the AL, as did their .289 BA. Their potent offense also led the league in OBP, SLG, and OPS. Pitching did not measure up to the 2002 team, placing 8th in both ERA and WHIP. Their staff did lead the AL in strikeouts and ranked third in strikeout-to-walk rate.

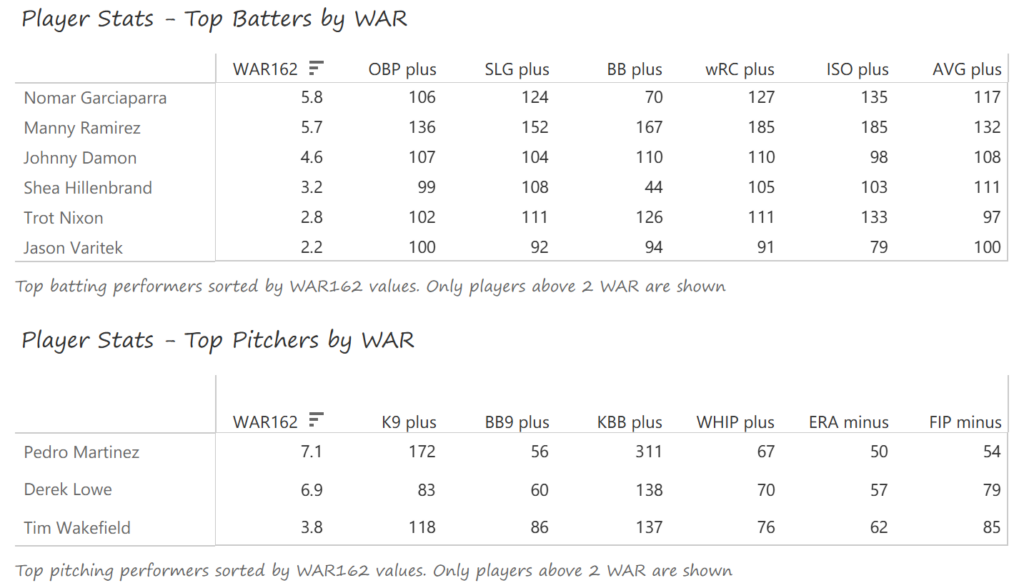
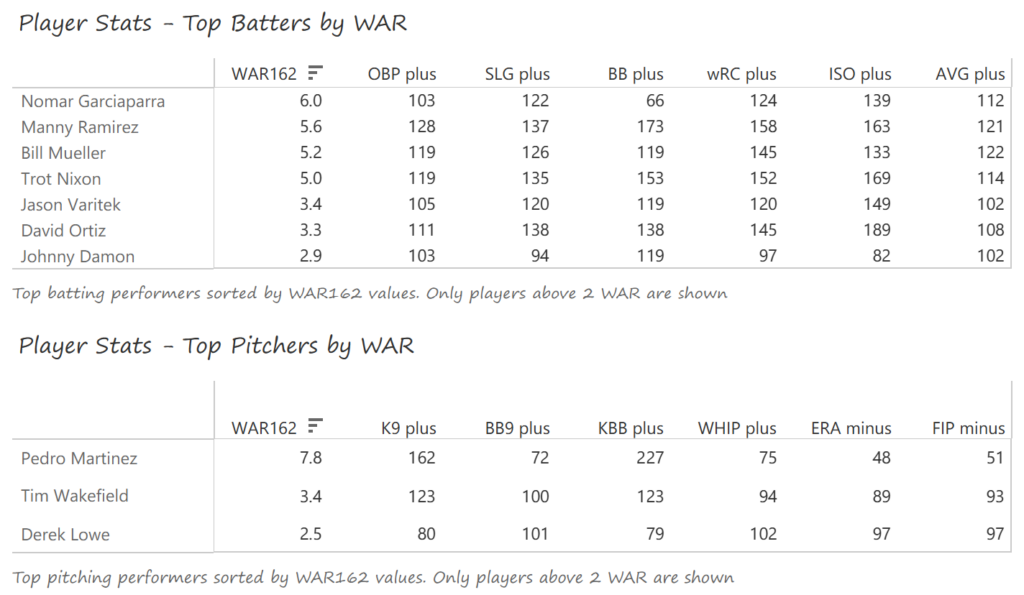
Nomar Garciaparra and Manny Ramirez again led the offense, this time bolstered by Bill Mueller and Trot Nixon. Garciaparra batted .301 with 28 homers, 120 runs, and 105 RBI, while Ramirez batted .325 with 37 homers, 104 RBI, and 117 runs scored. Mueller topped the AL with a .326 BA, and Nixon mashed 28 homers while batting .306. Pedro Martinez was once again the ace, posting a 14-4 record with an AL-best 2.22 ERA. Tim Wakefield added 11 wins, while Derek Lowe won 17 but with an inflated 4.47 ERA.

Summary

That’s it for the second entry in our MLB Team Rankings for the 2000s decade! Stay tuned for the countdown from #10 to #6, arriving in a few days. As always, thanks for reading!