Welcome to the next countdown post in our series of 1920s MLB Team Rankings. As a reminder, the teams are ranked from #20 through #1 based on aggregate WAR162. For the 1920s (1920-1929), a total of 160 teams were eligible (16 teams x 10 seasons), so the top 20 teams are a fairly exclusive group. We’ll summarize each team, including portions of their team dashboard, and explain how they attained their ranking. So, without further ado, here are the teams ranked #15 through #11.
Here’s the interactive dashboard at Tableau Public: 1920s Top 20 MLB Teams Dashboard
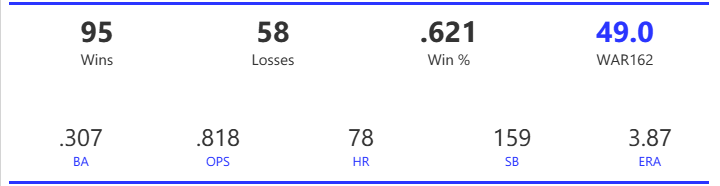
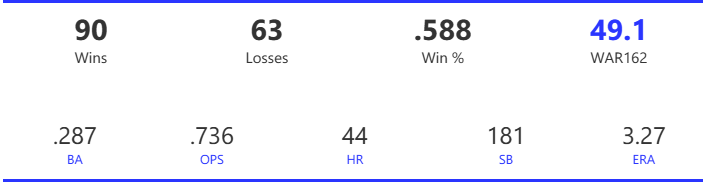
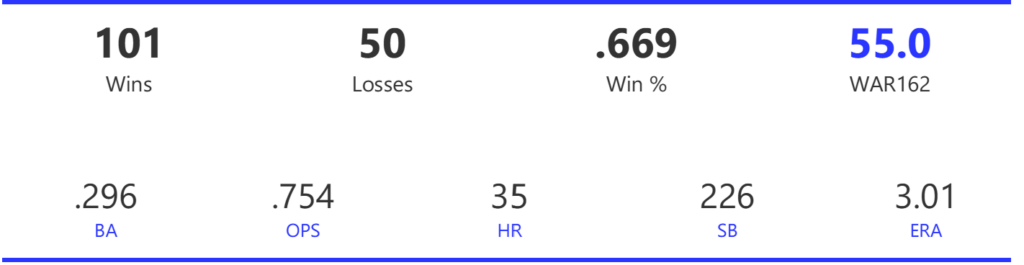
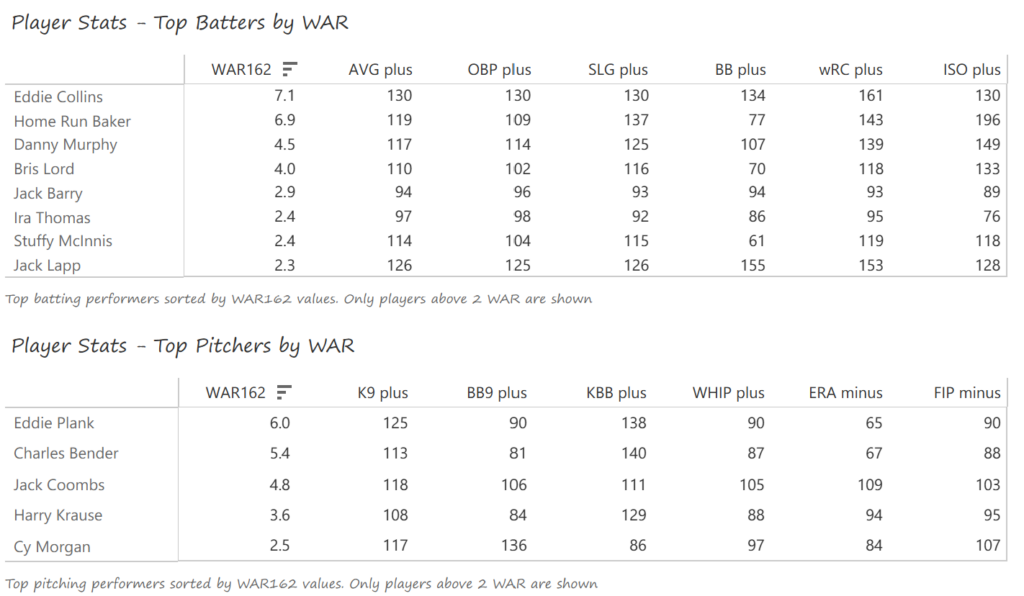
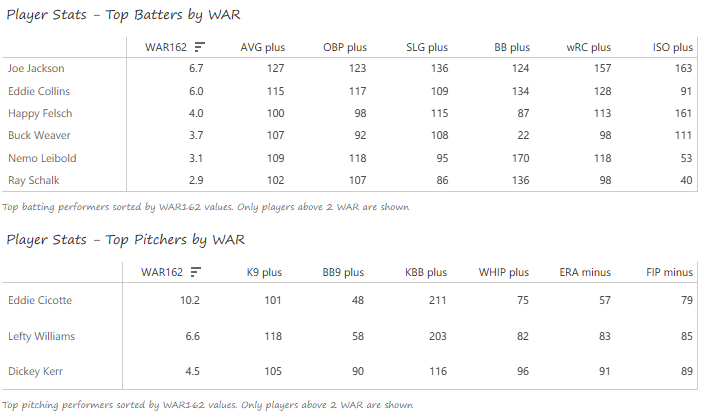
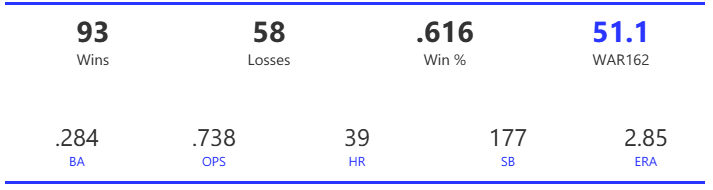
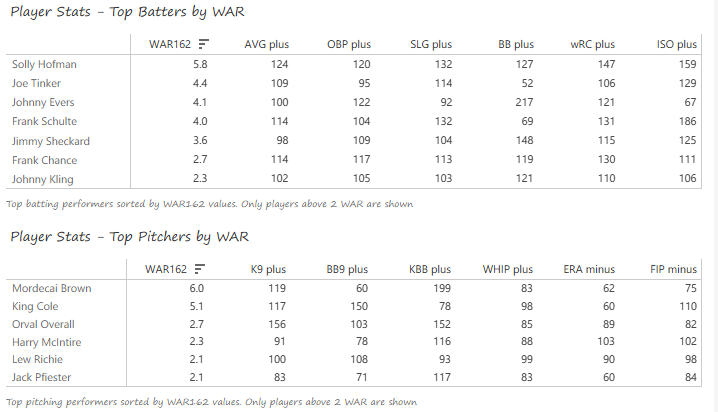
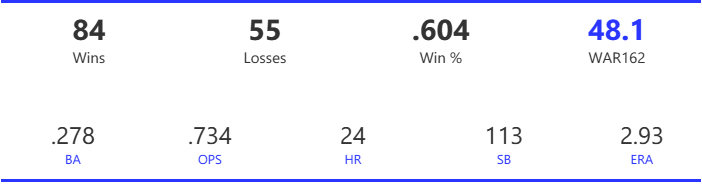
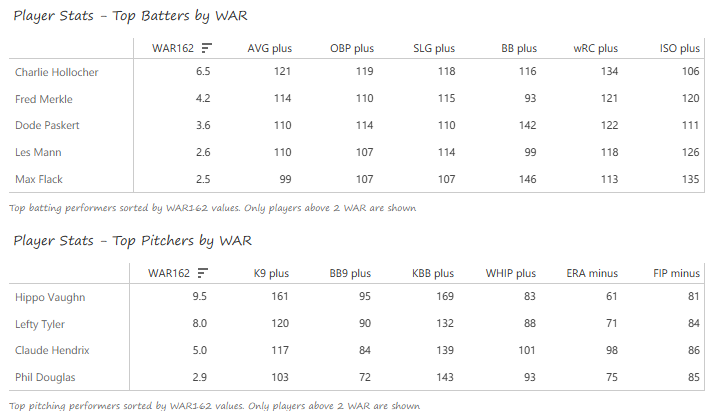
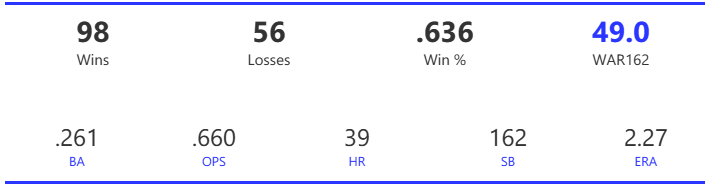
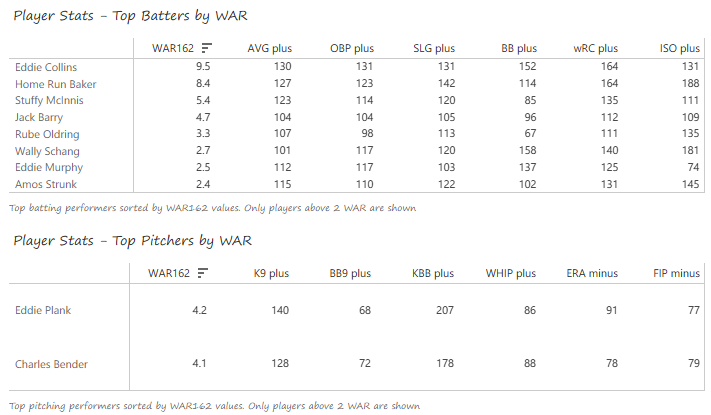
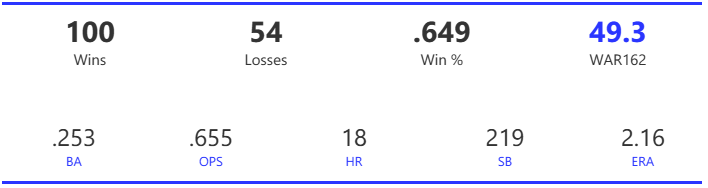
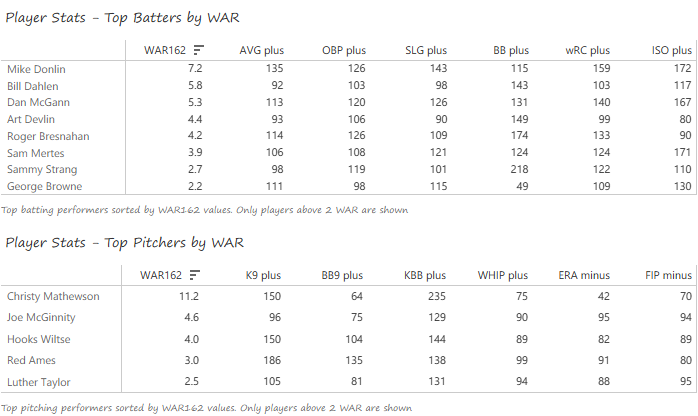
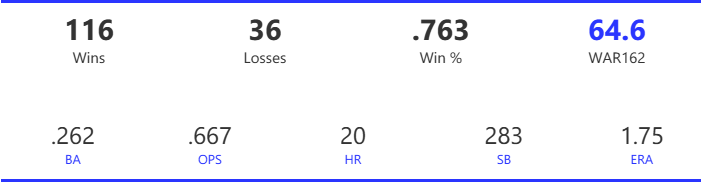
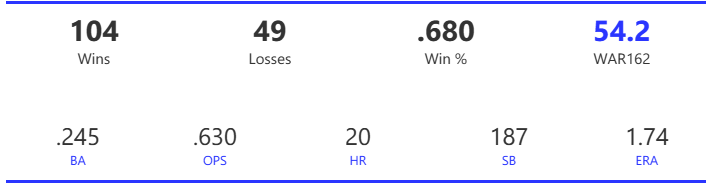
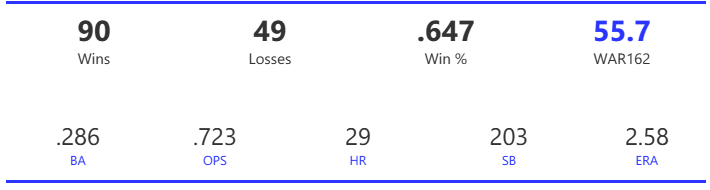
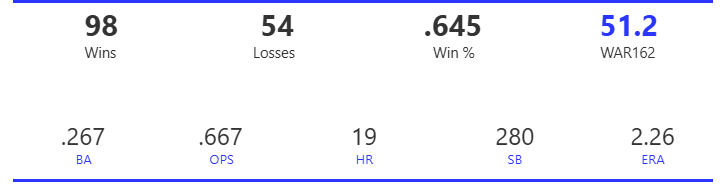
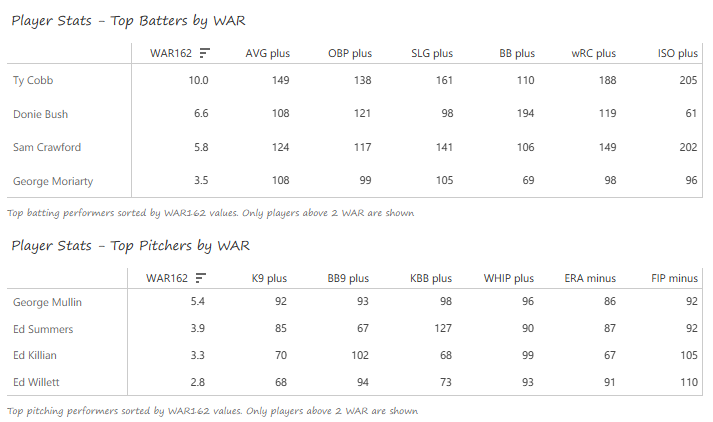
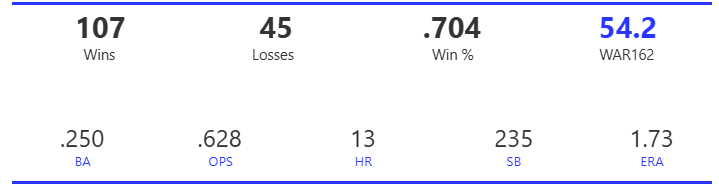
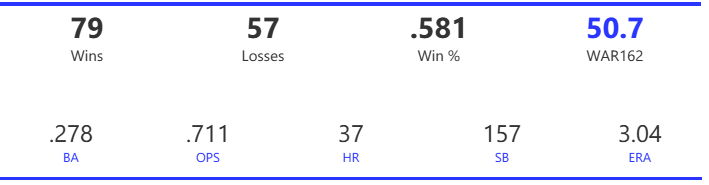
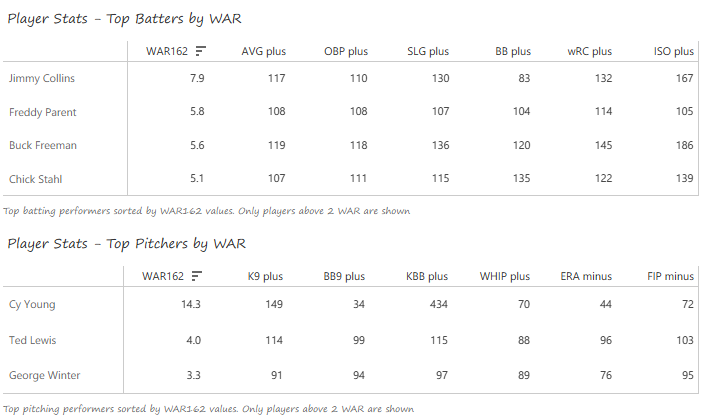
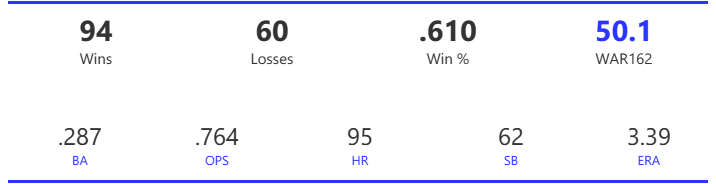
#15: 1929 Chicago Cubs, 49.6 WAR162
The 1929 Cubs ran away from their rivals in Pittsburgh and New York, finishing 10.5 games ahead of the second-place Pirates. While they claimed the NL pennant, they were soundly defeated by a powerful Athletics team in a 5-game World Series.
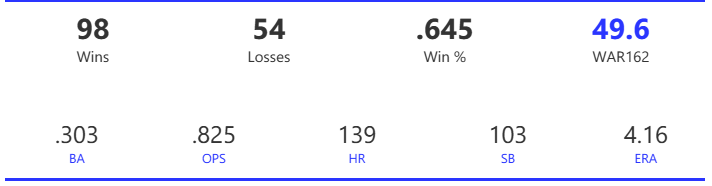
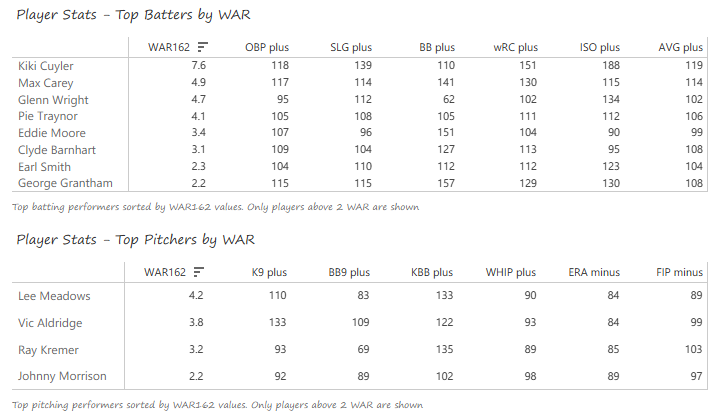
The Cubs rolled to 6.3 runs per game in a high-octane offensive season in the NL. The Cubs were considered a bit fortunate by the Pythagorean projection, which had them at 94 wins, still the best in the league. Their 982 runs were 78 more than the Pirates could muster, and their .303 BA, .377 OBP, 139 home runs, and .825 OPS all ranked second, behind the Phillies, who benefited from a better offensive home field environment. The Cubs pitchers ranked second in ERA, first in shutouts, second in strikeouts, and second in strikeout-to-walk rate.
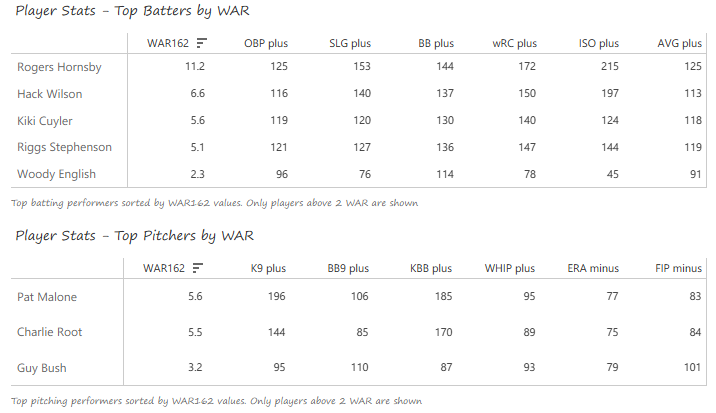
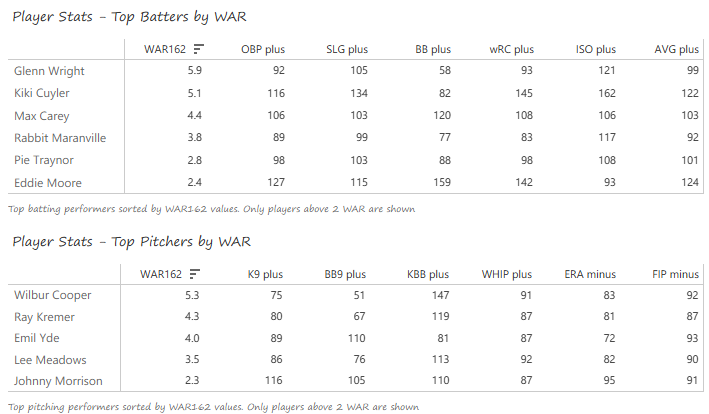
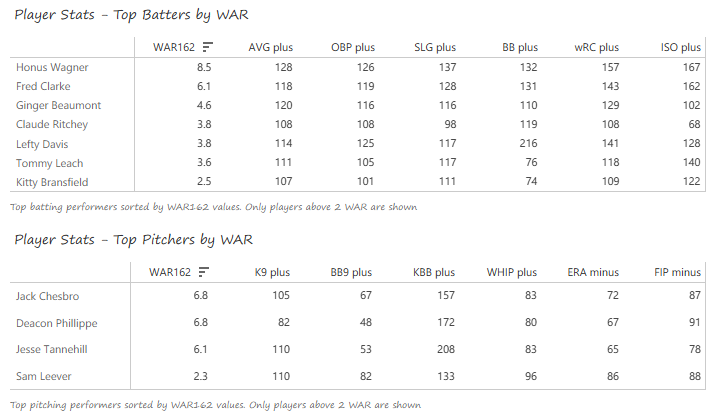
The legendary Rogers Hornsby spent four seasons with the Cubs, with 1929 ranking as the best of his tenure. Hornsby scored 156 runs (NL-best), batted .380, slugged 39 home runs, and had a league-leading 1.139 OPS. Hack Wilson, Kiki Cuyler, and Riggs Stephenson all provided ample support behind Hornsby. Wilson belted 39 homers with an NL-best 159 RBI, while batting .345. Cuyler led the NL with 43 steals, batted .360, and scored 111 runs, while Stephenson batted .362 with 17 homers. The Cubs were a powerful run-scoring team, even given the high offensive levels in 1929. Their pitching was led by Pat Malone (22-10, 3.57 ERA) and Charlie Root (19-6, 3.47 ERA). Malone led the league with 166 strikeouts.
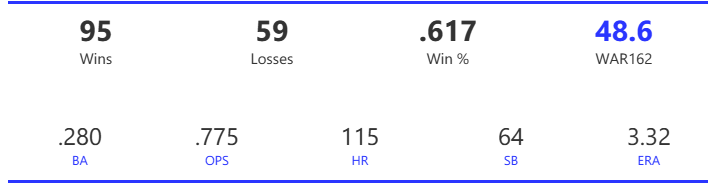
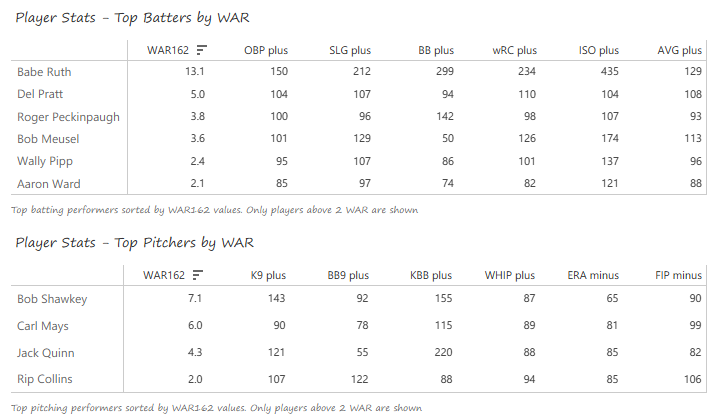
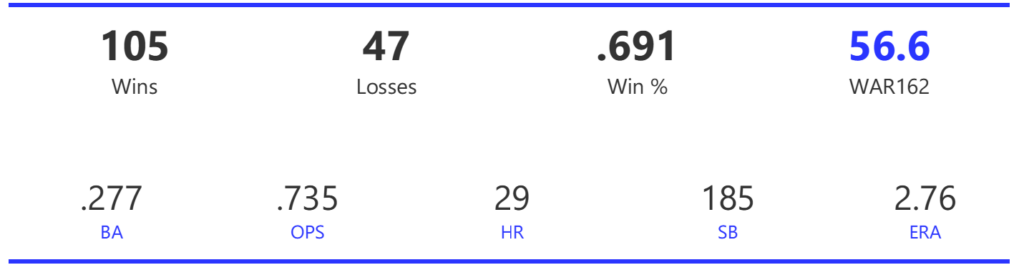
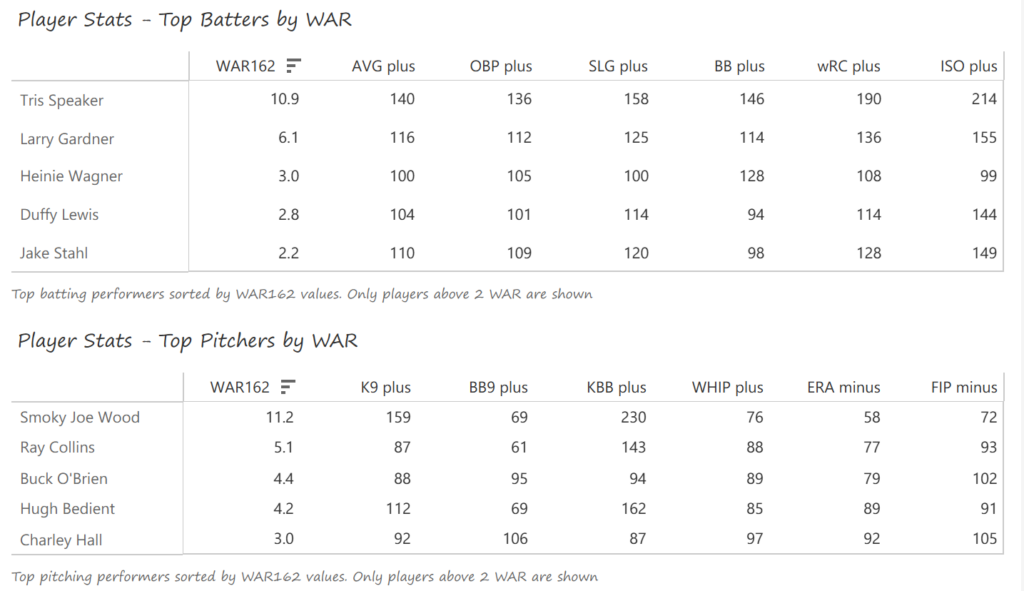
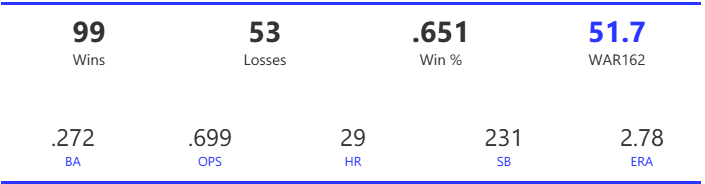
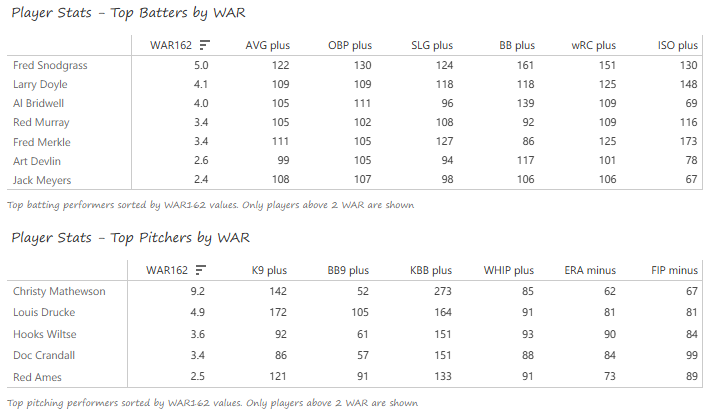
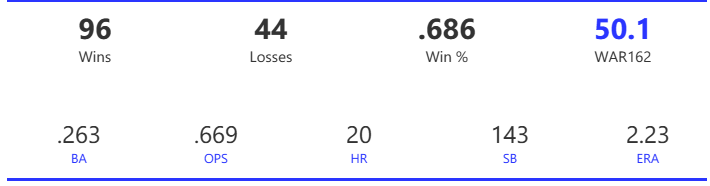
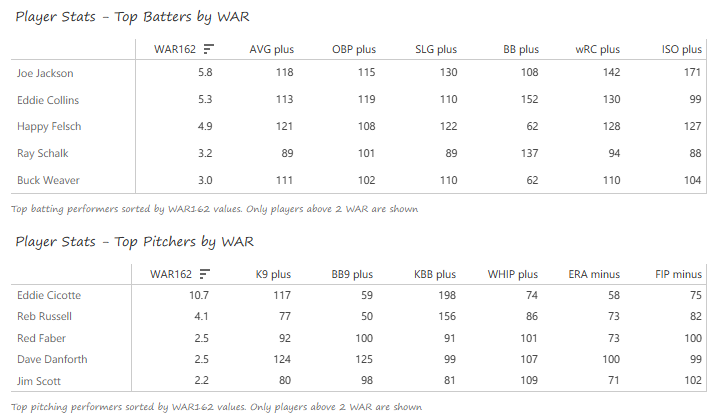
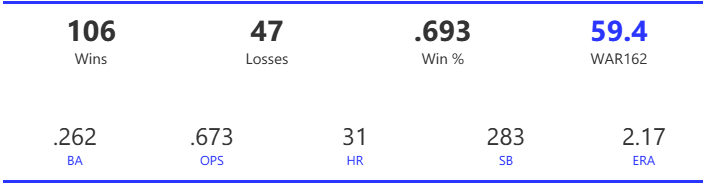
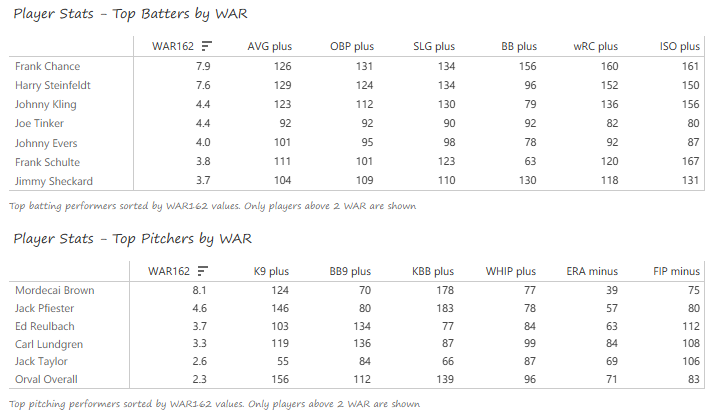
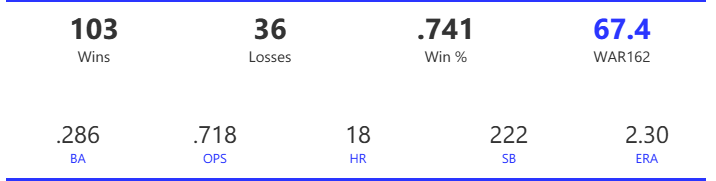
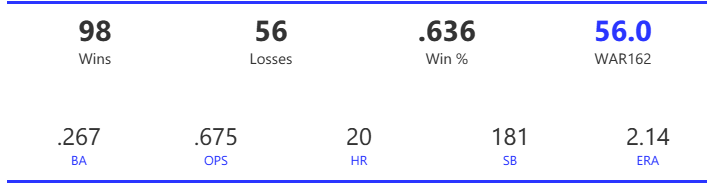
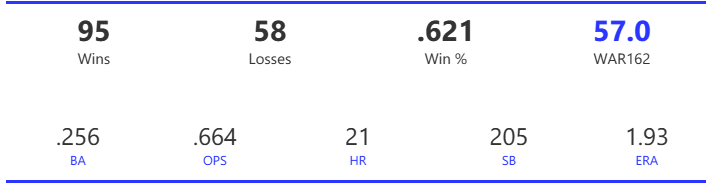
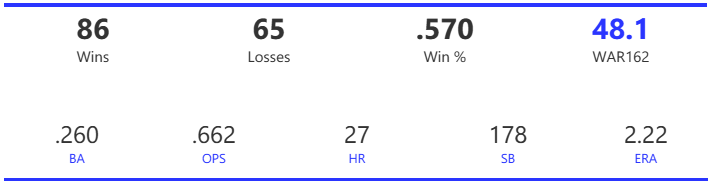
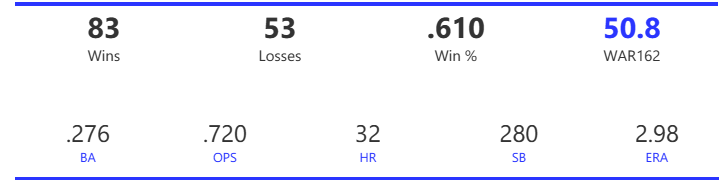
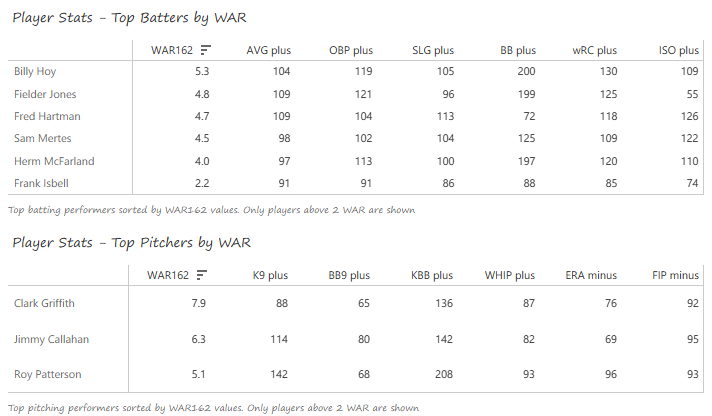
#14: 1922 New York Yankees, 50.1 WAR162
The 1922 Yankees snuck past the upstart Browns to claim the AL pennant by a single game. Pythagorean win projections have the Browns as the better team (by 7 games), but the Yankees exceeded their projection while the Browns fell well short of their expected 98 wins.
The Yankees were a rather ordinary offensive team, and certainly not a great one. They ranked fourth in runs, third in homers, fourth in BA, and third in OPS, and were below the league average in other categories. Pitching is what propelled them to the top; they ranked second in ERA, first in WHIP, and second in strikeout-to-walk rate.

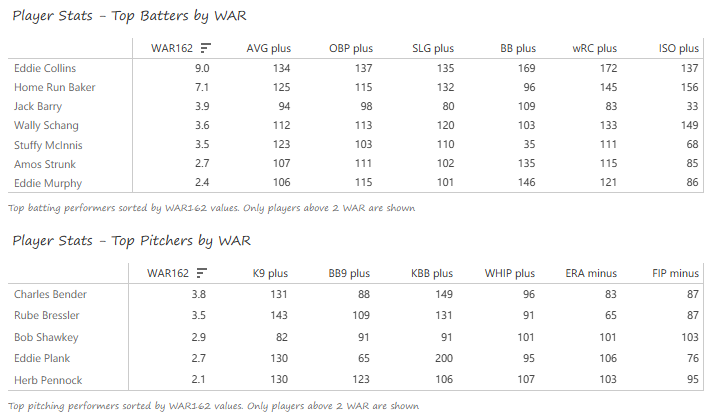
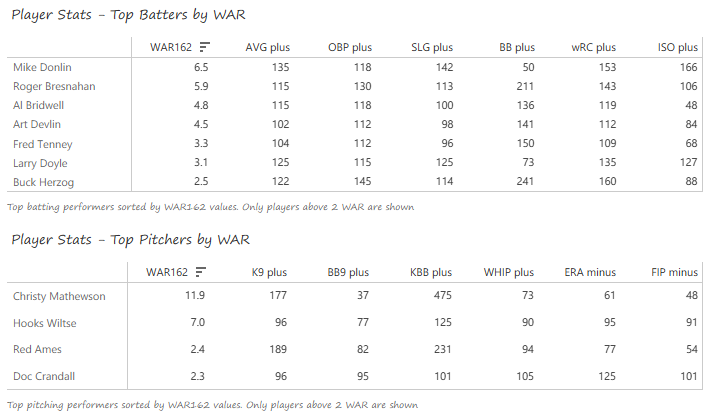
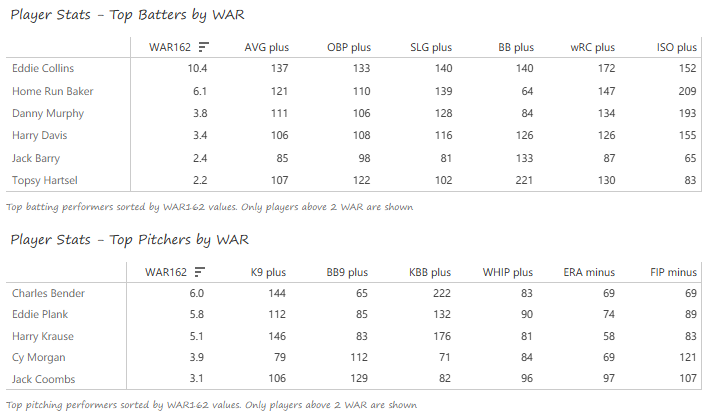
Babe Ruth led the team in WAR, despite playing just 110 out of 154 games. His 1.106 OPS topped the AL, and he added a .315 BA, 35 homers, and 96 RBI. Wally Pipp batted .329 with 94 RBI, Wally Schang hit .319. Bob Meusel added his own .319 BA to go with 88 RBI. The pitching staff stepped up in the absence of a huge season from Ruth, led by Bob Shawkey. Shawkey won 20 games while posting a 2.91 ERA, while Bullet Joe Bush posted a glitzy 26-7 mark. Waite Hoyt had a strong season at age 22, going 19-12, and Carl Mays and Sad Sam Jones each added 13 wins.
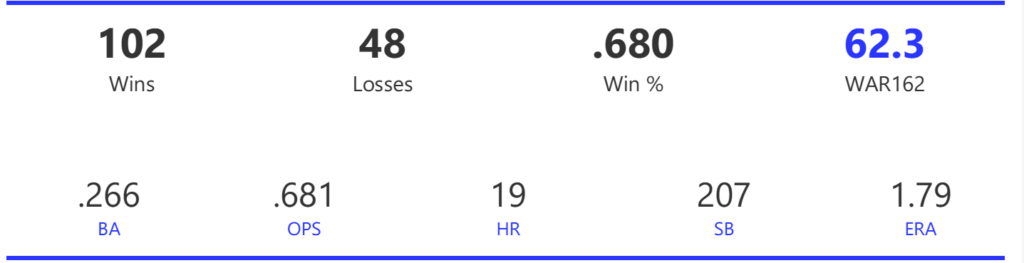
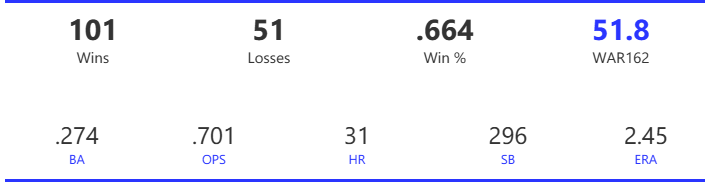
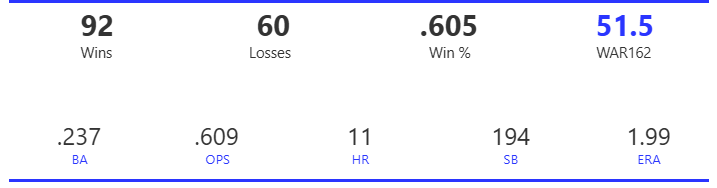
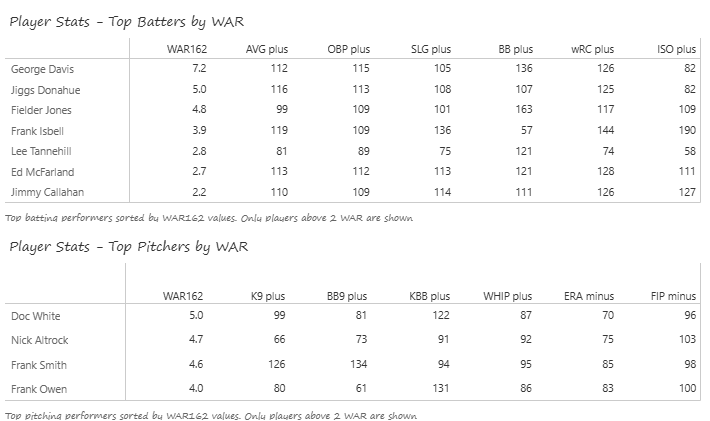
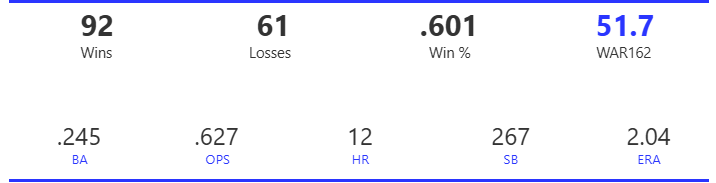
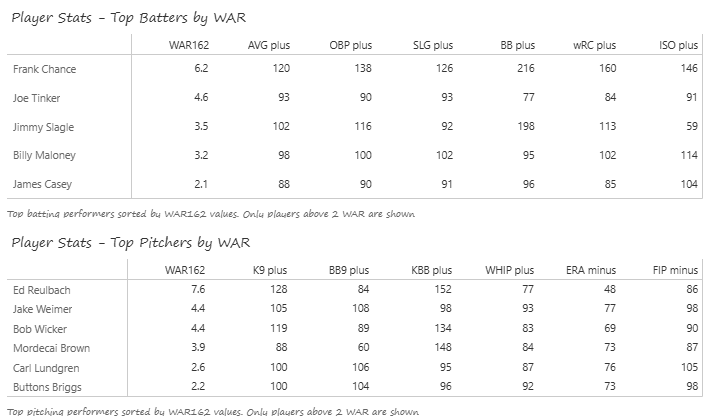
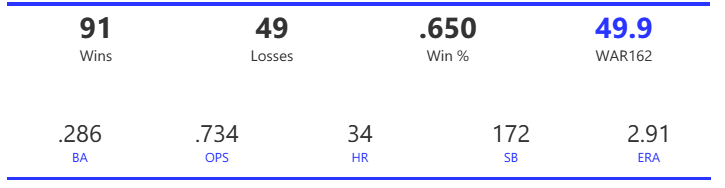
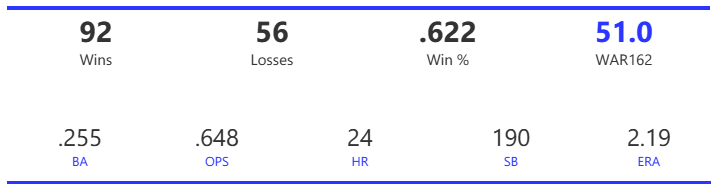
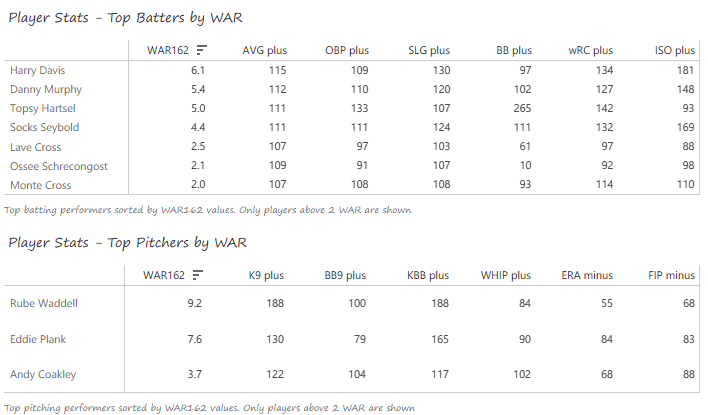
#13: 1924 Washington Nationals, 50.1 WAR162
The 1924 Nationals outlasted the Yankees, riding the arms of their pitching staff to the first of back-to-back AL pennants. Their 92-62 record was exactly equal to the expected win projection, and landed them 2 games ahead of the New Yorkers. They then went on to defeat the Giants in a 7-game World Series.
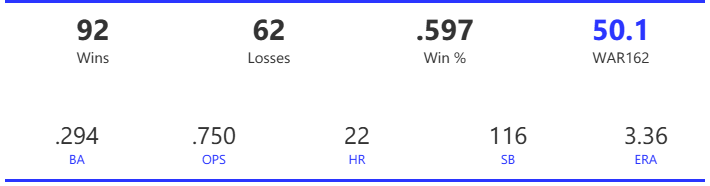
The Nationals took home the pennant despite a lackluster offense that saw them finish sixth in runs scored and last in home runs. Their offense was more like a deadball-era team: they ranked first in triples and second in stolen bases, but were quite ordinary in other metrics. Pitching made the difference for the Nationals, as their ERA was by far the best in the AL; they also led in WHIP and hits per 9 innings, and were near the top in other measures.
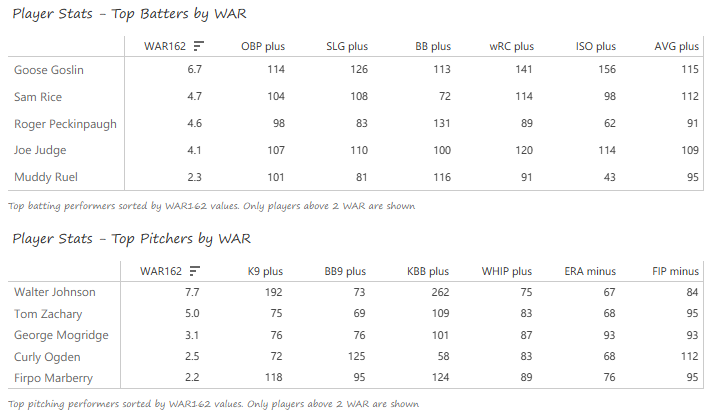
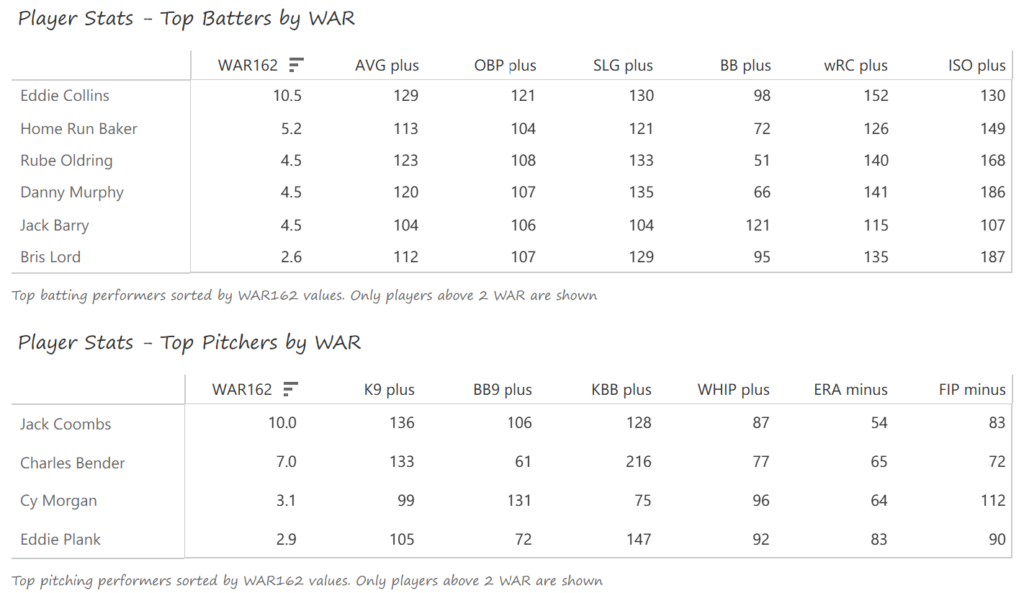
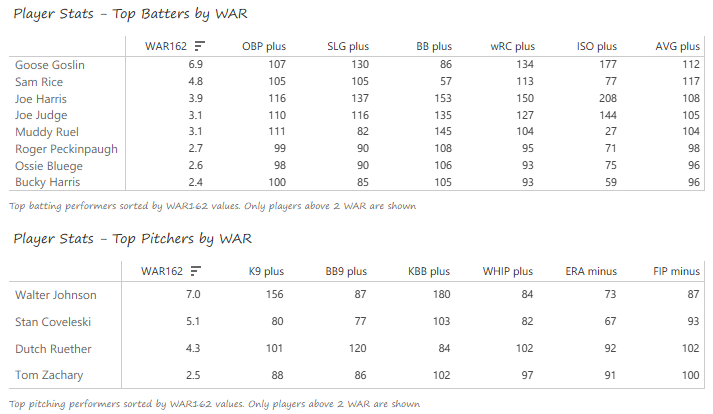
Goose Goslin was the Nationals’ top offensive threat, batting .344 with an AL-best 129 RBI and 12 of the team’s 22 homers. Sam Rice batted .334 and scored 106 runs, while Roger Peckinpaugh earned a .360 OBP from his shortstop position. Joe Judge batted .324 with 79 RBI to round out the Nationals’ top producers. The ageless Walter Johnson was finally rewarded with a pennant, leading the AL in wins (23), ERA (2.72), shutouts (6), and strikeouts (158) in his age-36 season. Tom Zachary won 15 with a 2.75 ERA, and George Mogridge added 16 more wins to provide solid support behind Johnson.
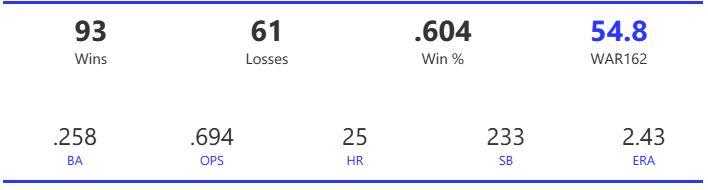
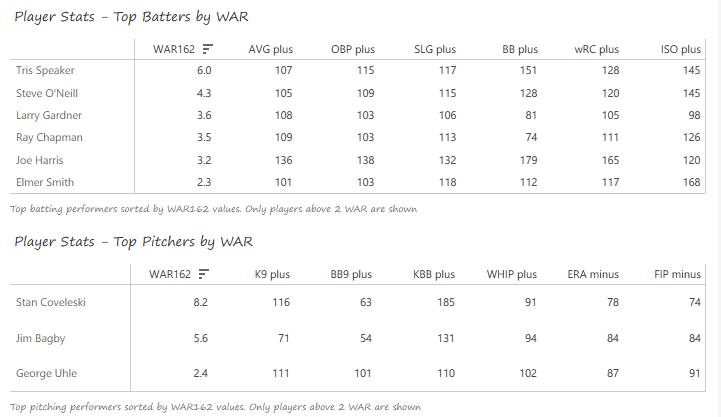
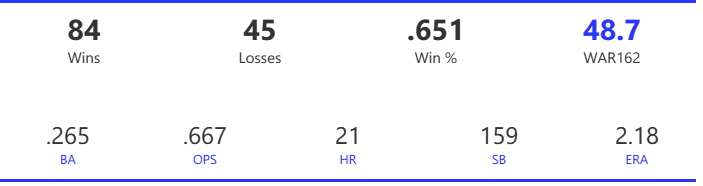
#12: 1925 Washington Nationals, 50.2 WAR
The 1925 Nationals repeated as AL champs, this time topping the Athletics by a comfortable 8.5 game margin. However, their return trip to the World Series was spoiled by the Pirates in another 7-game series. The team would not return to a similar level of success until the early 1930s.
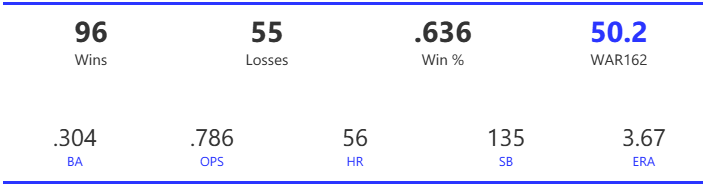
The Nationals offense once again paled compared to several AL rivals. Their 828 runs placed fourth, same as their .786 OPS. They ranked first in stolen bases and second in both BA and OBP, so their offense was slightly improved compared to the 1924 edition. Once again, the Nationals staff posted the top ERA, WHIP, and hits per 9 innings marks.
Goose Goslin again led the offense, batting .334 with an NL-best 20 triples. He also cracked 18 homers, had 113 RBI, and 116 runs scored. Sam Rice again was the next biggest threat, batting .350 with 111 runs scored. Joe Harris batted .323 with 12 homers in just 100 games, and Joe Judge (.314 BA) and Muddy Ruel (.310 BA) provided additional support. Walter Johnson (age 37) and Stan Coveleski (age 35) each won 20 games, with Coveleski posting an AL-best 2.84 ERA. Dutch Ruether chipped in with 18 wins to give the Nationals a strong mound trio.
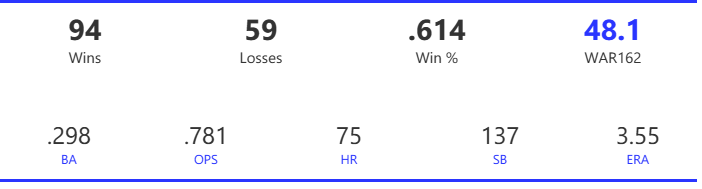
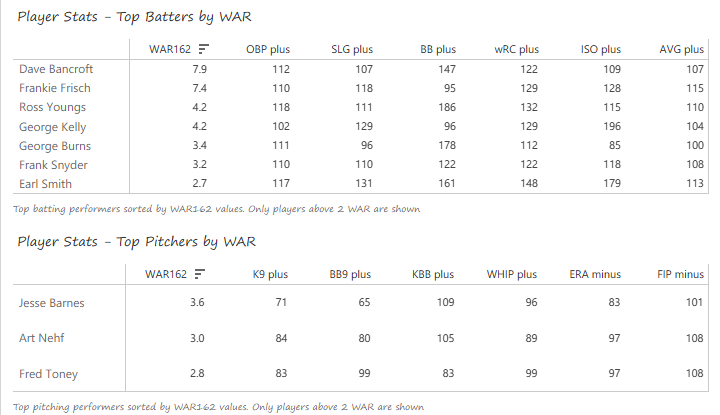
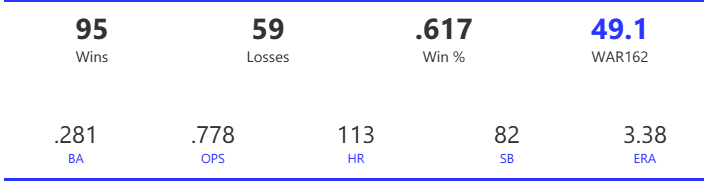
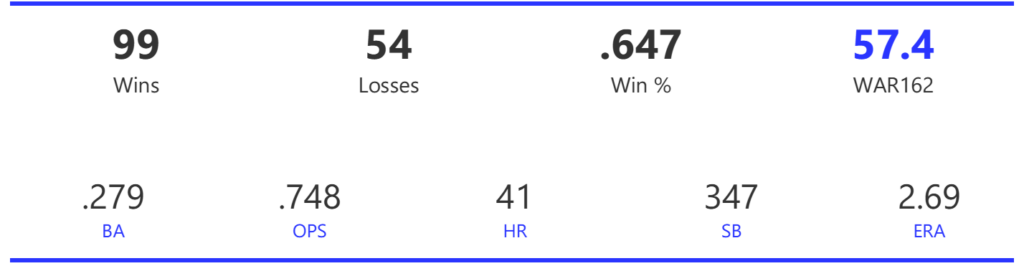
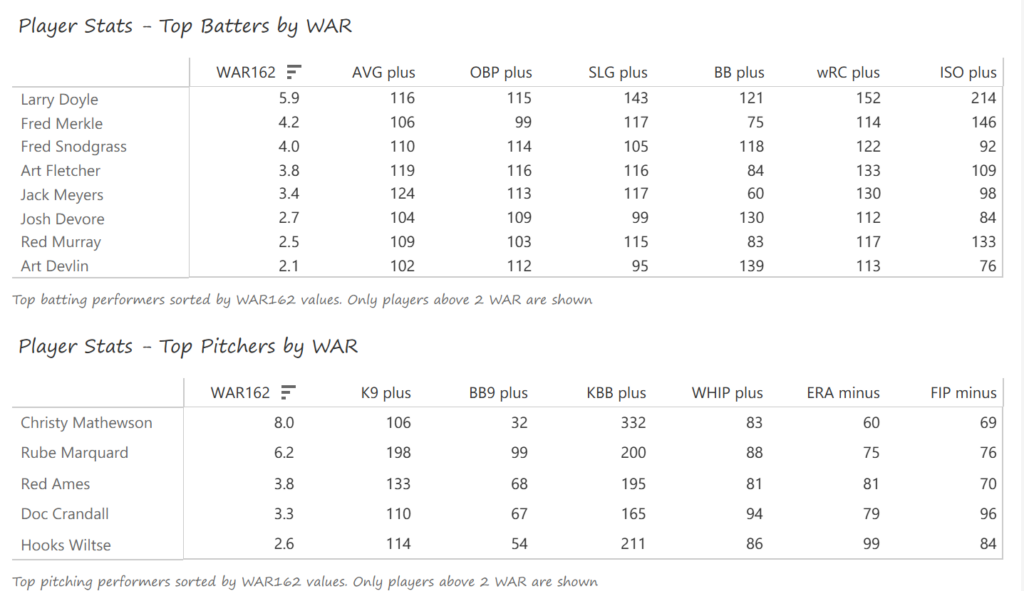
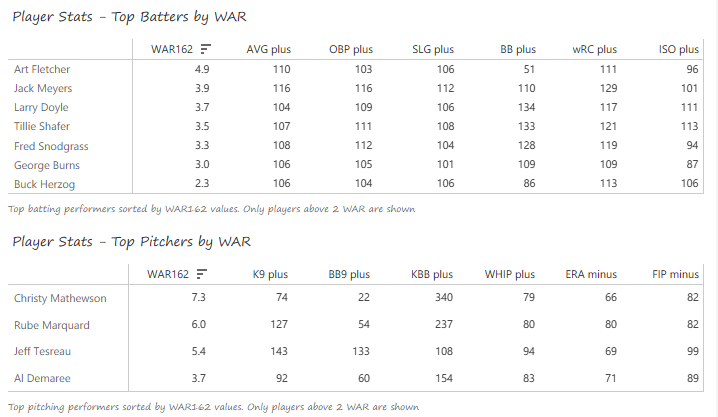
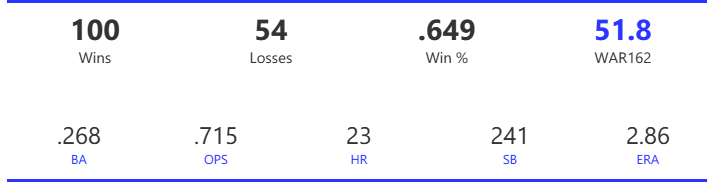
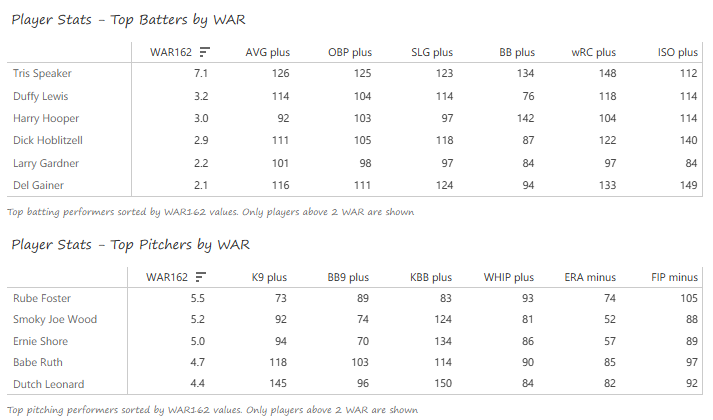
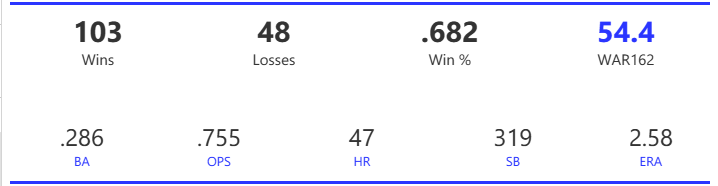
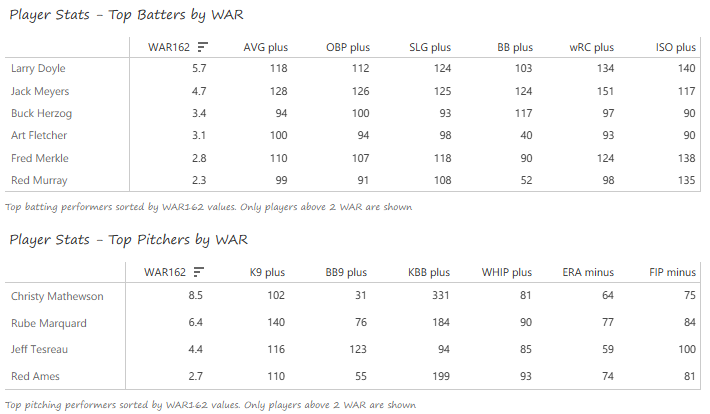
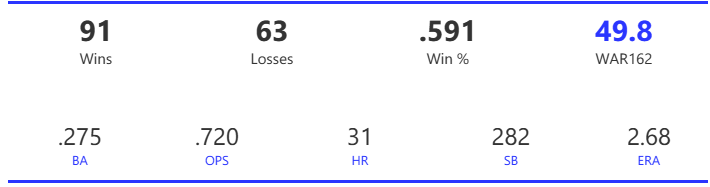
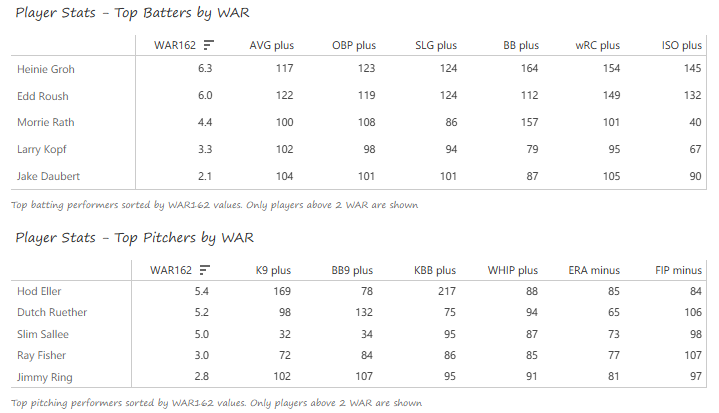
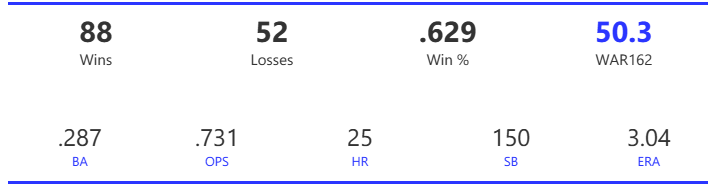
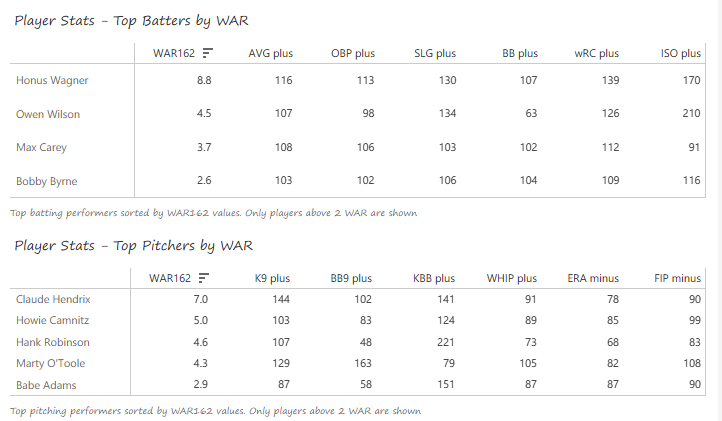
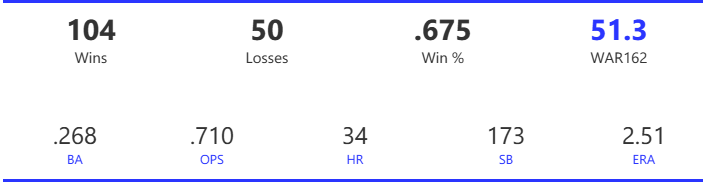
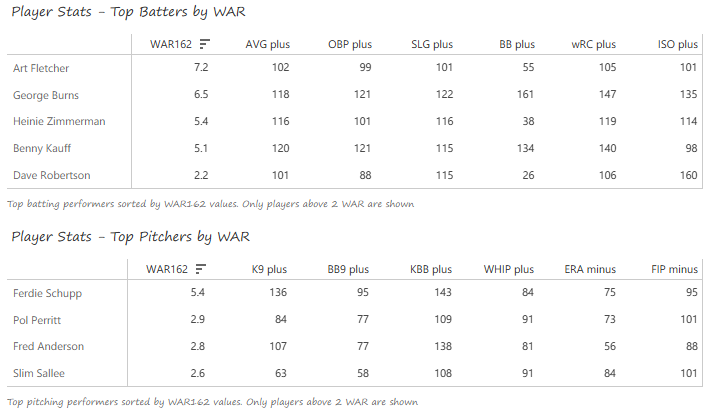
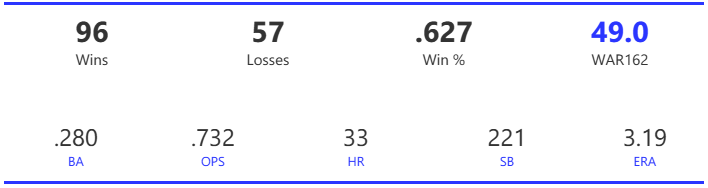
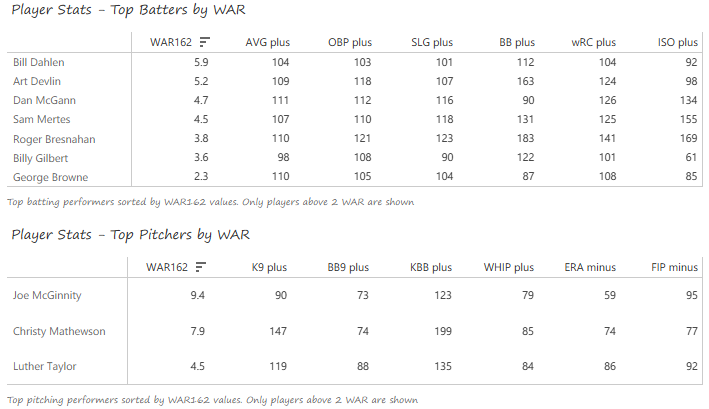
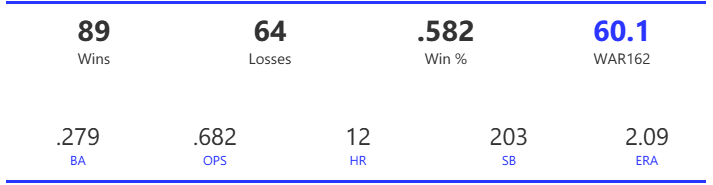
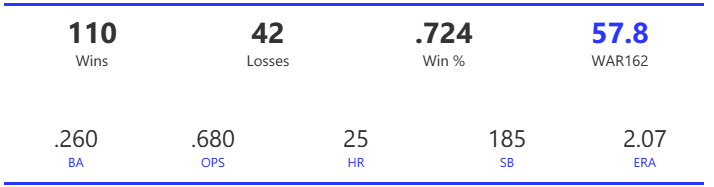
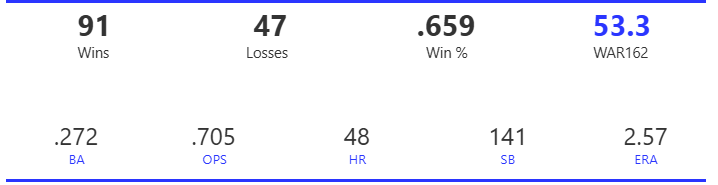
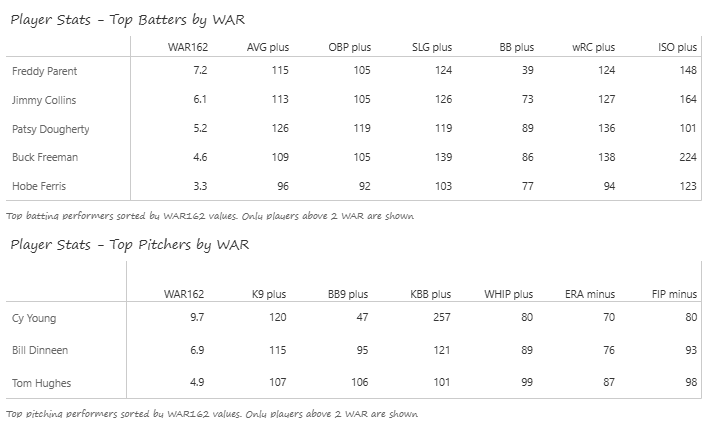
#11: 1924 New York Giants, 50.3 WAR
The 1924 Giants edged the Brooklyn Robins (1.5 games back) and Pittsburgh Pirates (4.5 back) in a three-team race for the NL pennant. The Giants would go on to lose to the Senators in a classic 7-game World Series.
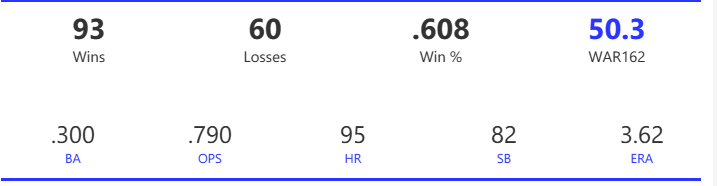
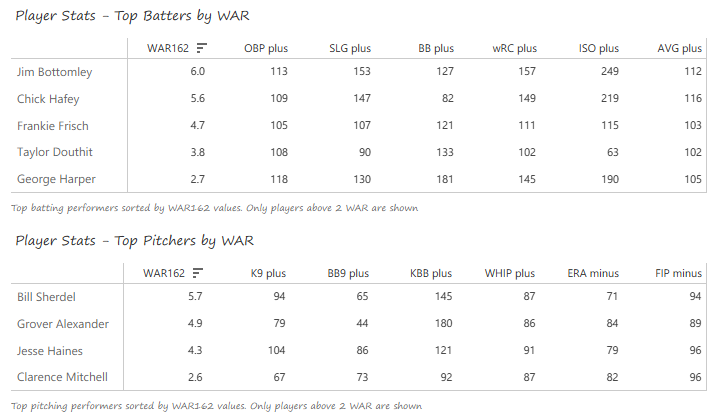
The Giants had a big offense in 1924 that carried them to the pennant. Their 857 runs scored topped the Cardinals by 117 runs, and they made a clean sweep of the BA, OBP, and OPS metrics. They also ranked at or near the top in doubles, homers, and walks. The Giants’ pitching was adequate, but clearly not the equal of their offense. They ranked third in ERA, fourth in WHIP, and first in saves (with 19).
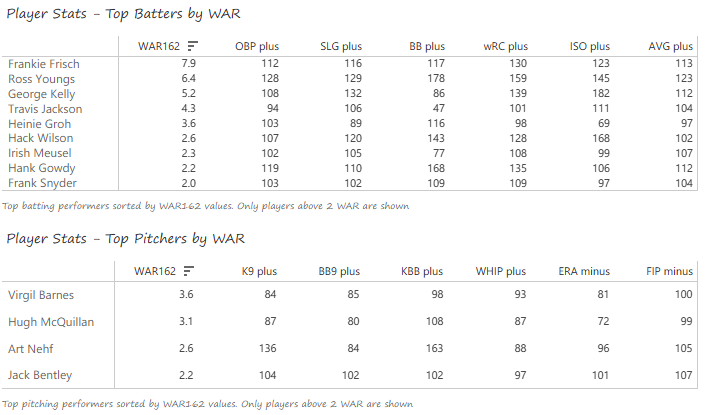
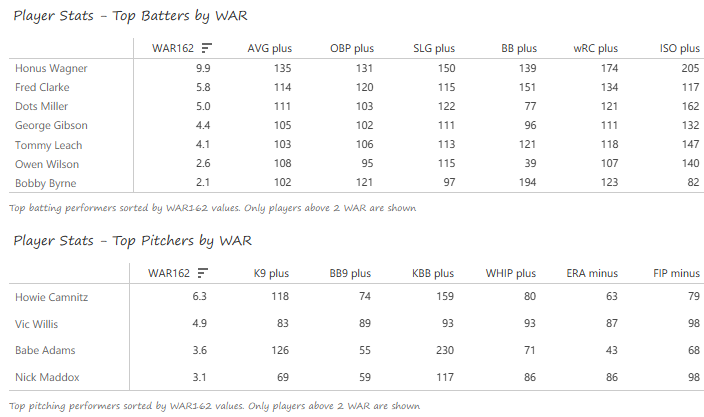
Frankie Frisch led a deep positional lineup, batting .328 with an NL-best 121 runs scored to go with his excellent range at second base. Ross Youngs batted a robust .356 with 112 runs scored, while George Kelly led the NL with 136 RBI to go with 21 homers. The left side of the infield was productive – shortstop Travis Jackson batted .302 in his age-20 season, and 3rd baseman Heinie Groh batted .281 in his age-34 season. On the mound, Virgil Barnes posted a 16-10 mark, while Hugh McQuillan added 14 wins with a 2.69 ERA. Art Nehf (14) and Jack Bentley (16) combined for another 30 wins.
Summary
That’s it for this entry in our MLB Team Rankings for the 1920s decade! Stay tuned for the countdown from #10 to #6, arriving in a few days. As always, thanks for reading!