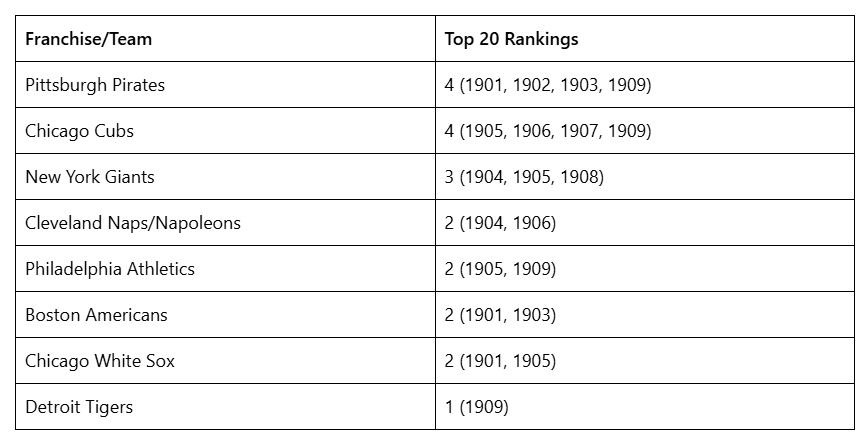
Welcome to the next countdown post in our series of 1910s MLB Team Rankings. As a reminder, the teams are ranked from #20 through #1 based on aggregate WAR162. For the 1910s (1910-1919), a total of 160 teams were eligible (16 teams x 10 seasons), so the top 20 teams are a fairly exclusive group. We’ll summarize each team, including portions of their team dashboard, and explain how they attained their ranking. So, without further ado, here are the teams ranked #10 through #6.
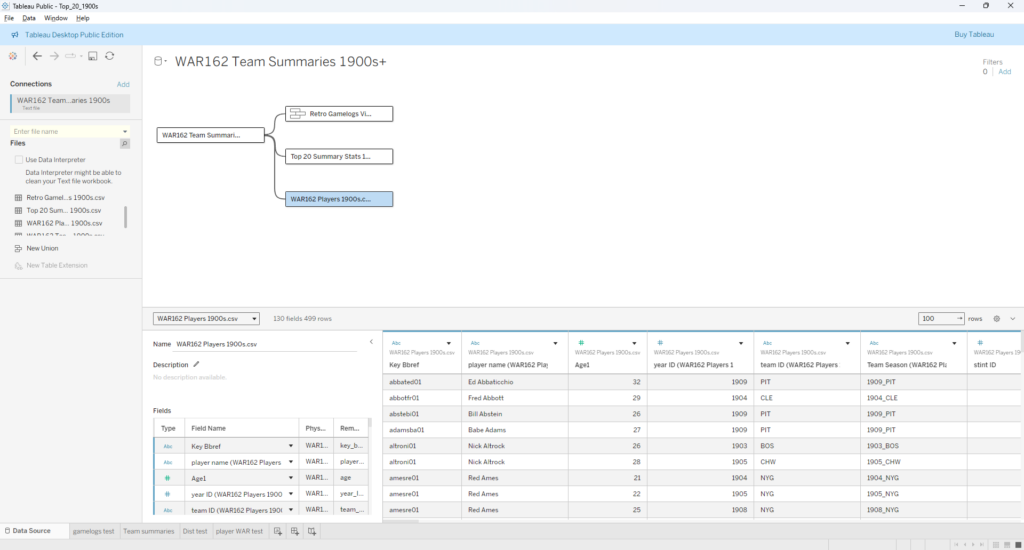
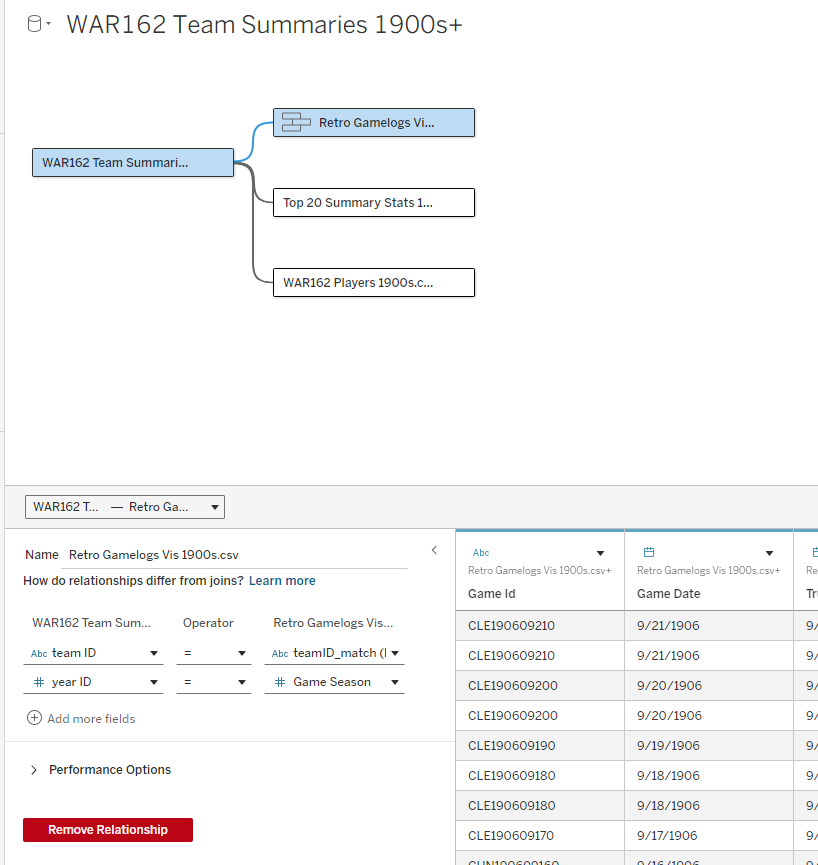
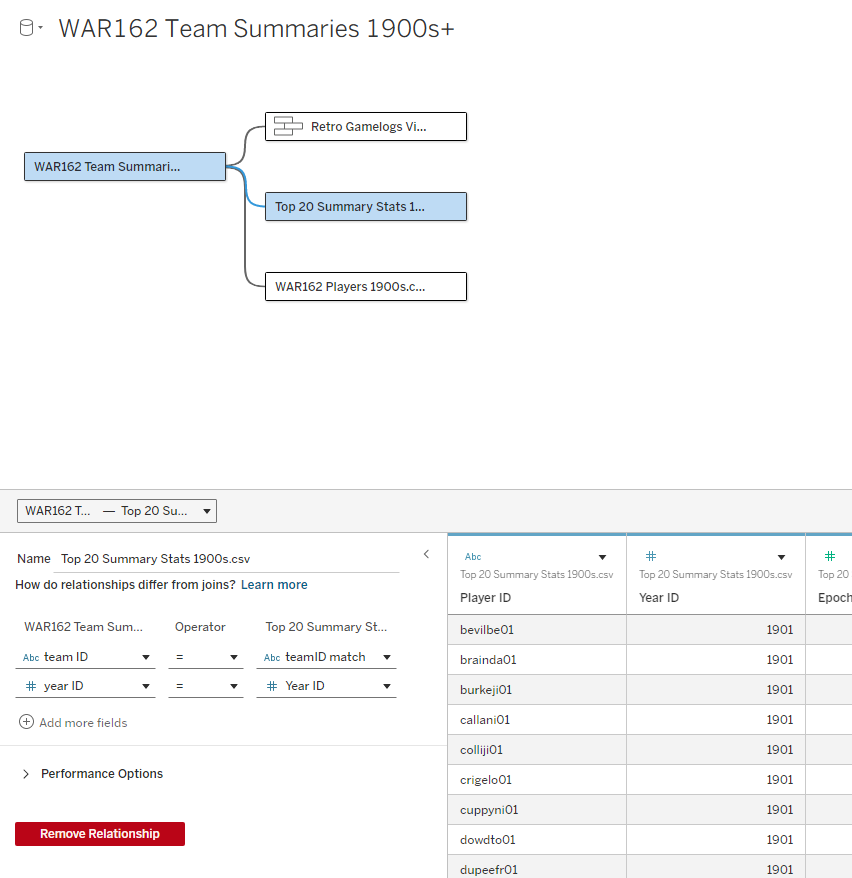
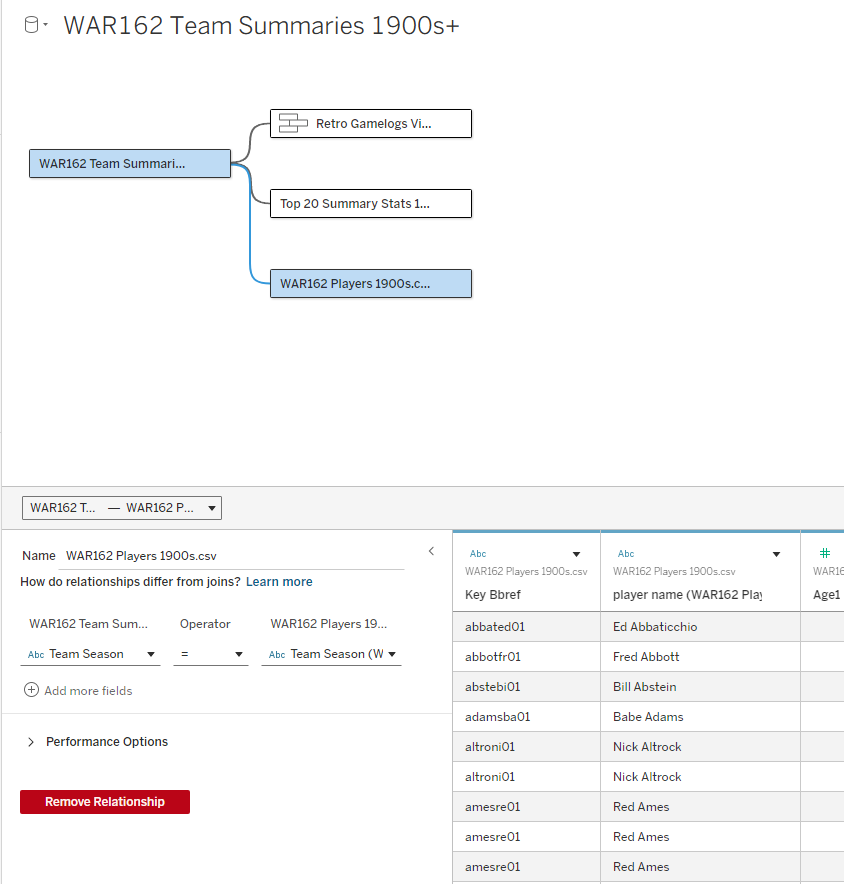
Here’s the interactive dashboard at Tableau Public: 1910s Top 20 MLB Teams Dashboard
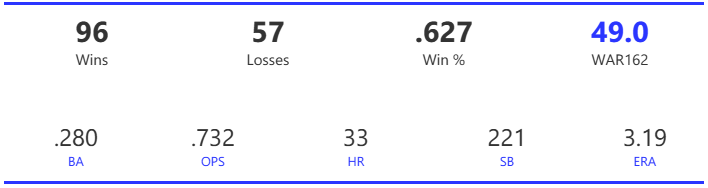
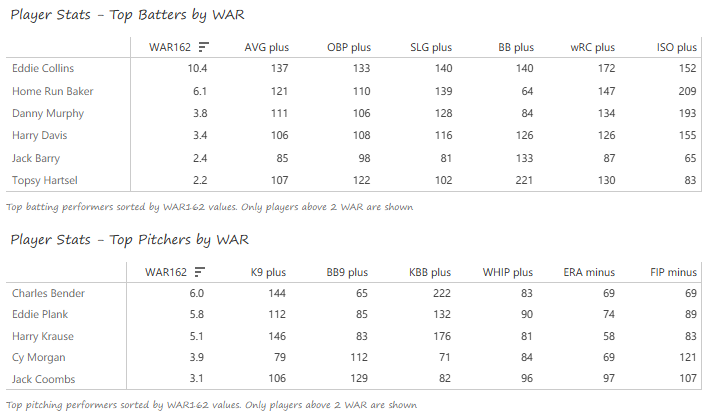
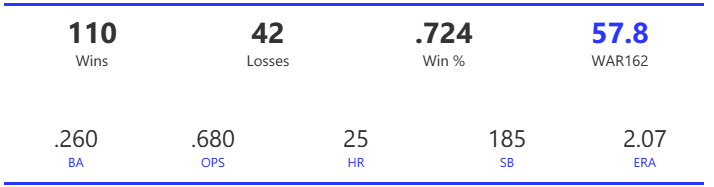
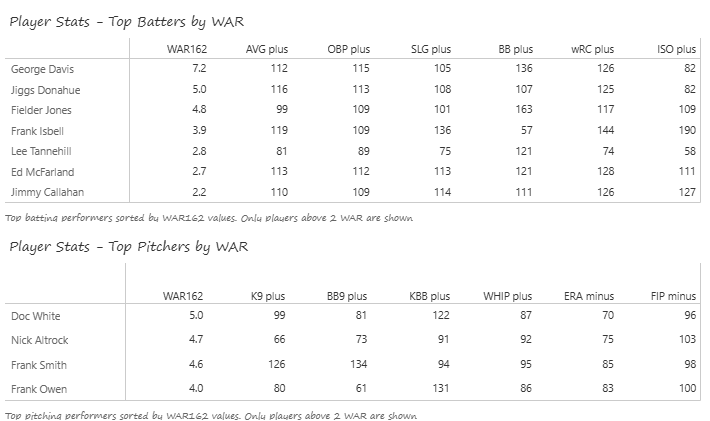
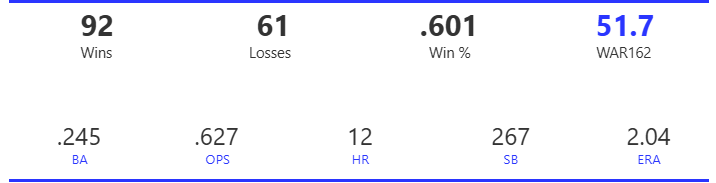
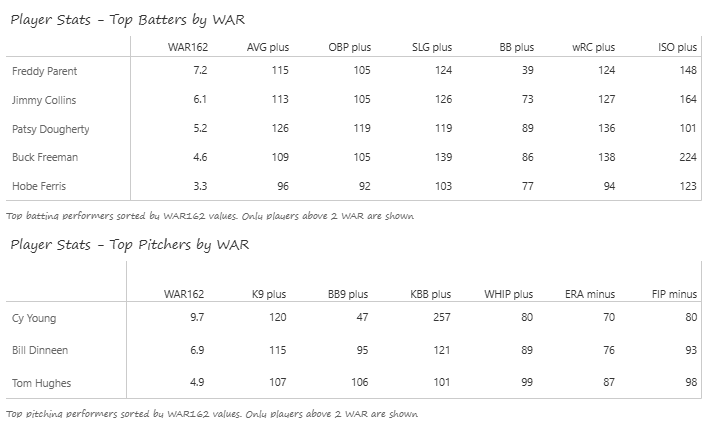
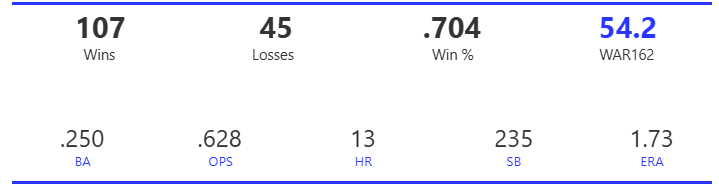
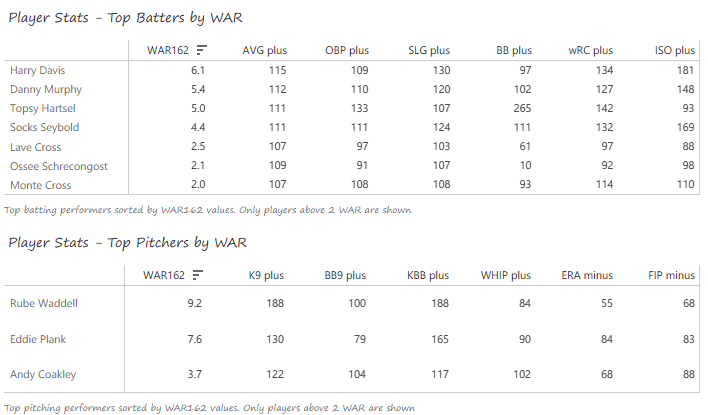
#10: 1914 Philadelphia Athletics, 51.7 WAR162
The 1914 Athletics ran away with the AL pennant, topping the runner-up Red Sox by 8.5 games. Their run differential far surpassed all rivals as they continued a dominant run with one of their final great teams of this era. The team was especially dominant versus right-hand pitching, posting a 70-29 mark.
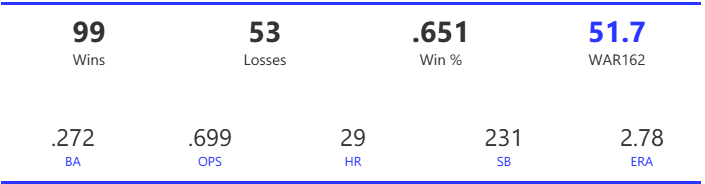
The Athletics offense embarrassed their AL rivals by scoring 134 more runs than the next team, and easily led the AL in BA, OBP, and OPS. The A’s weakness was a relatively ordinary pitching staff that placed 4th in ERA, 6th in WHIP, and 5th in strikeout-to-walk rate. The pitching staff was adequate in supporting a great offense, but it kept this squad from an even higher ranking.
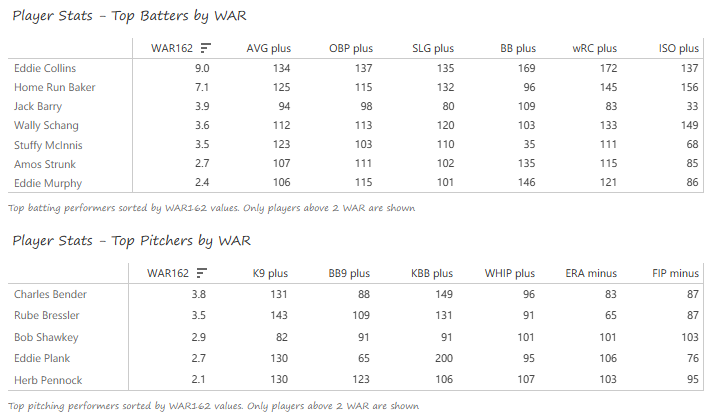
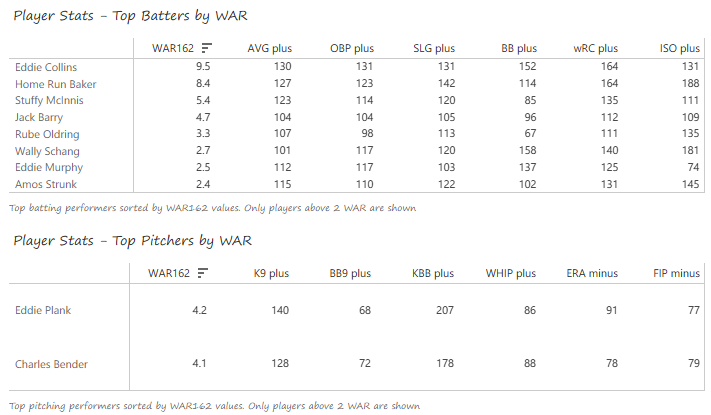
Eddie Collins was the offensive leader, ably supported by Home Run Baker, a 1-2 punch that led this era of A’s teams to several pennants. Collins batted .344 with a .904 OPS, scored an NL-best 122 runs, and swiped 58 bases. Baker led the league with 9 homers, posted an .822 OPS, and drove in 85 runs. The A’s had additional positional depth courtesy of Jack Barry at shortstop, Wally Schang (.287 BA) at catcher, and Stuffy McInnis (.314 BA, 95 RBI) at first base. Charles Bender (“Chief”) logged a 17-3 mark with a 2.26 ERA, Rube Bressler went 10-4, primarily in relief, and Bob Shawkey won 15 games. Eddie Plank (38) and Herb Pennock (20), at opposite ends of the age spectrum, contributed 26 wins.
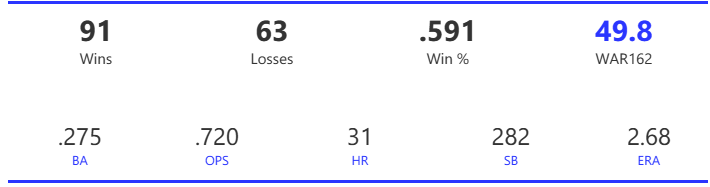
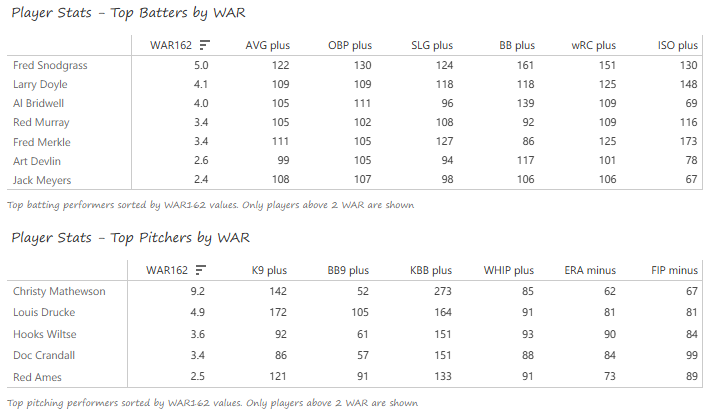
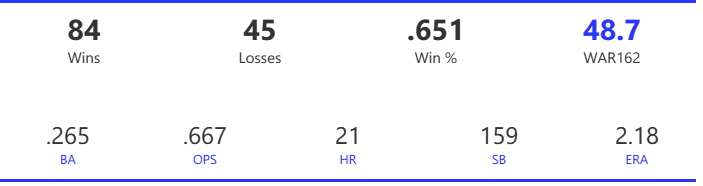
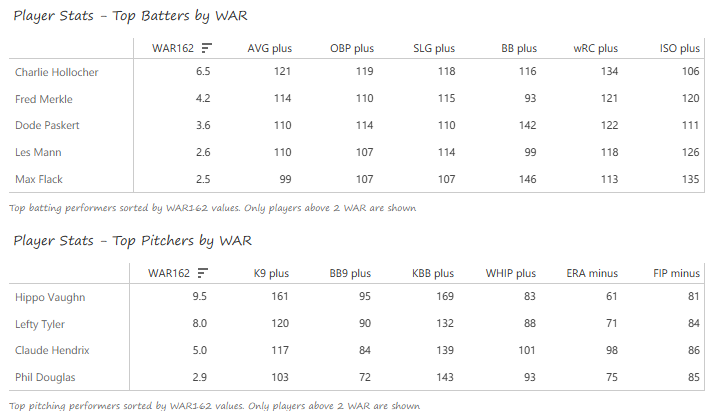
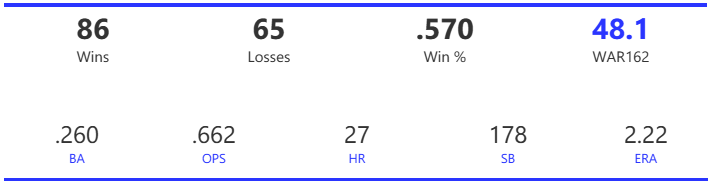
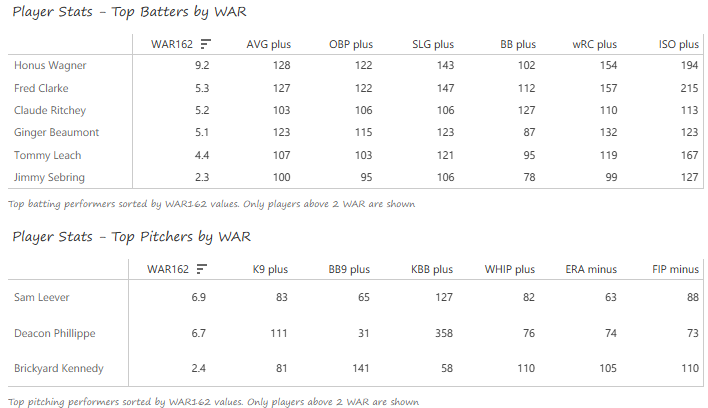
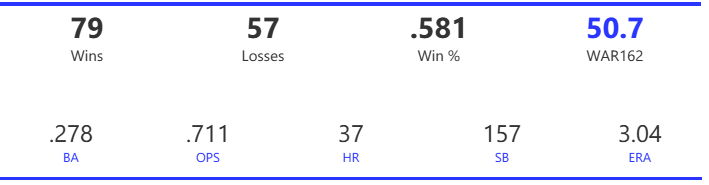
#9: 1913 New York Giants, 51.8 WAR162
The 1913 edition of the Giants continued its dominance of the NL, waltzing to a 12.5 game margin over the Phillies. This would be the last great Giants team for some years, as a variety of NL clubs (Braves, Phillies, Robins) would top the NL over the next three seasons.
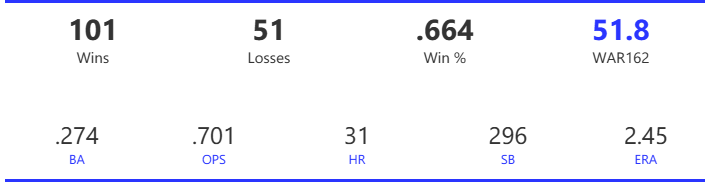
The Giants possessed a capable if not outstanding offense, ranking third in runs, second in doubles, and third in OPS. They did lead the NL in BA and stolen bases by solid margins. Pitching was the real strength of the team, with an ERA (2.42) far ahead of their NL rivals. They also easily topped the league in WHIP, hits per 9 innings, and strikeout-to-walk rate.
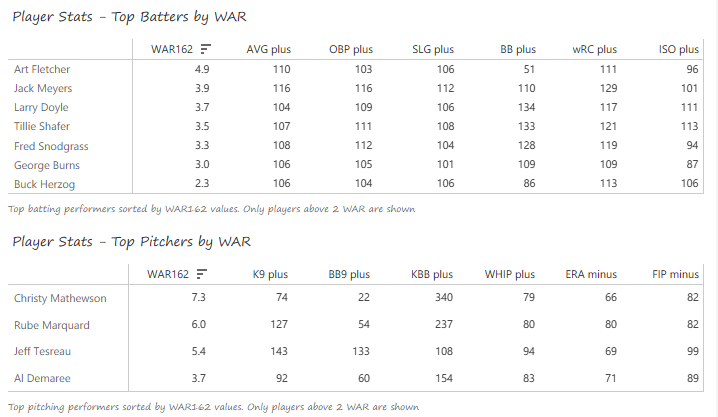
The Giants’ offense was characterized by contributions from a handful of solid role players, without any big stars. Shortstop Art Fletcher batted .297 with 71 RBI, catcher Jack Meyers was a .312 hitter, and 2ndc baseman Larry Doyle stole 38 bases while batting .280. Tillie Shafer batted .287 with 12 triples, and Fred Snodgrass batted .291 with 65 runs scored. The pitching staff was led by the veteran Christy Mathewson (25 wins, 2.06 ERA, NL-best 0.6 BB/9), Rube Marquard (23-10), and Jeff Tesreau (22-13, NL-best 7.1 hits per 9 innings).
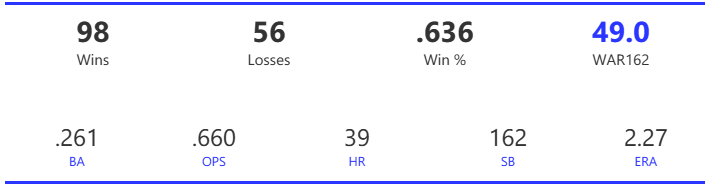
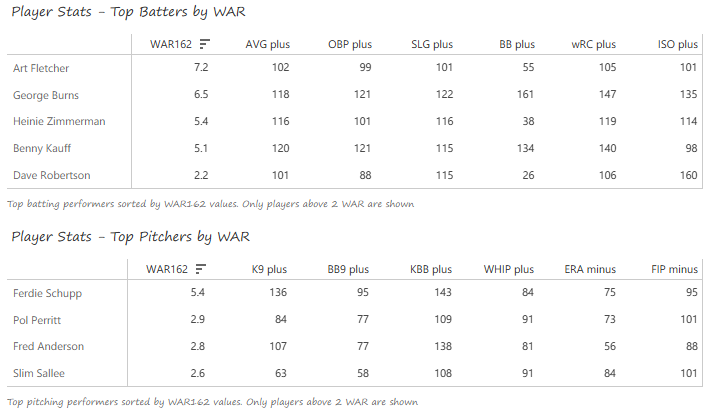
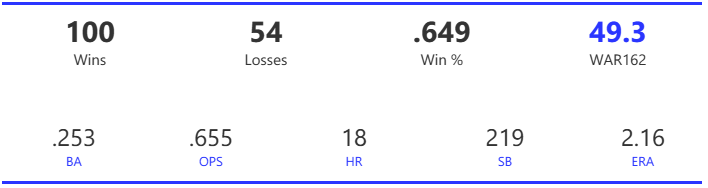
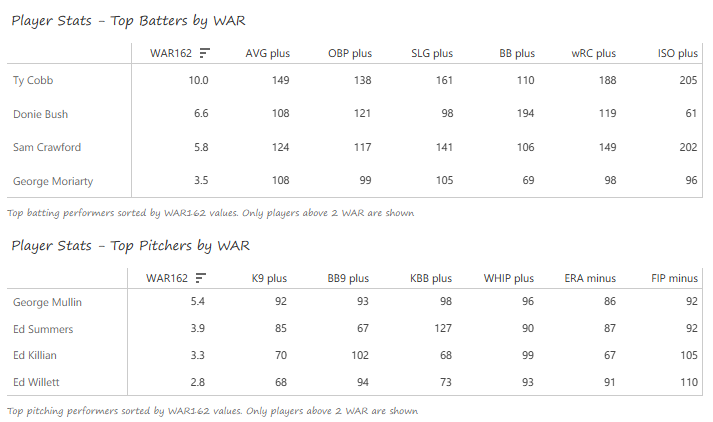
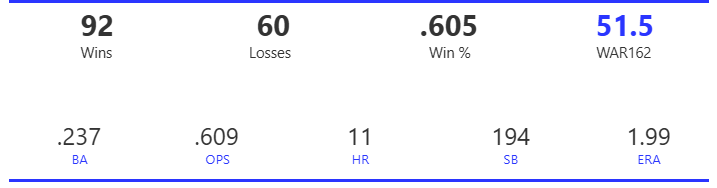
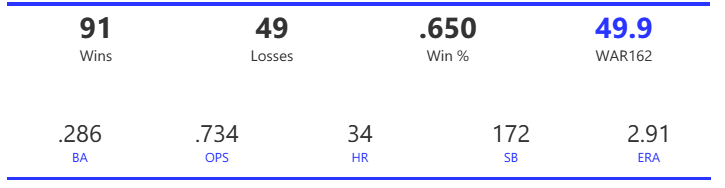
#8: 1915 Detroit Tigers, 51.8 WAR162
The 1915 Tigers finished second in the AL despite their 100-win season, trailing the Red Sox by 2.5 games. They were a lucky team for much of the season, with a 34-16 mark in one-run games; unfortunately for the Tigers, the Red Sox also exceeded their projected win total by several games.
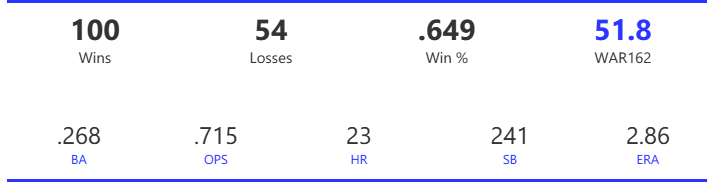
The Tigers were a high-scoring club, averaging 5 runs per game, far ahead of their AL rivals. They ranked first in BA, OBP, OPS, stolen bases, and doubles; it’s easy to understand why they scored so frequently. On the pitching side, they were merely average – fourth in ERA, fourth in WHIP, and fifth in strikeout-to-walk rate.
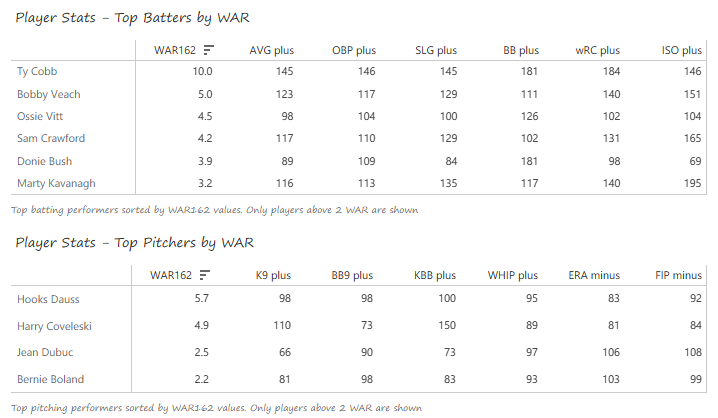
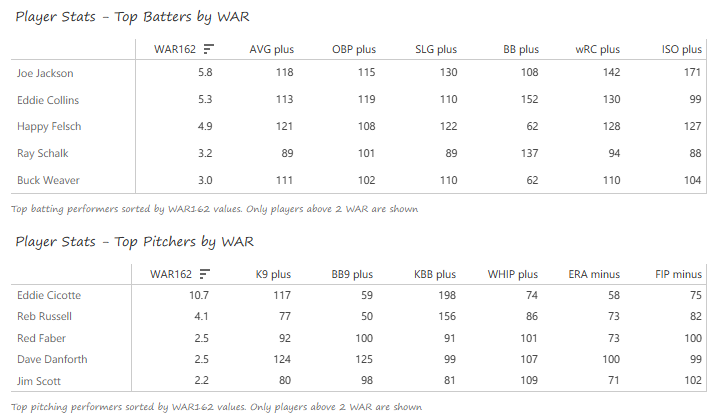
Ty Cobb was at the peak of his powers in the 1915 season, leading the AL in multiple categories – BA (.369), stolen bases (96), OPS (.973), and runs (144), to name a few. Cobb’s outfield mates Bobby Veach (.313 BA, 40 doubles) and Sam Crawford (19 triples, .299 BA) tied for the AL lead with 112 RBI apiece. Ossie Vitt (116 runs) was a solid contributor at third base, while light-hitting shortstop Donie Bush drew 118 walks. On the mound, Hooks Dauss (24-13) and Harry Coveleski (22-13) topped a rather average staff.
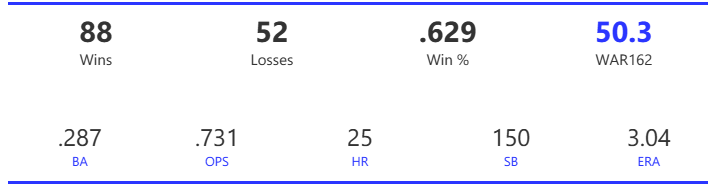
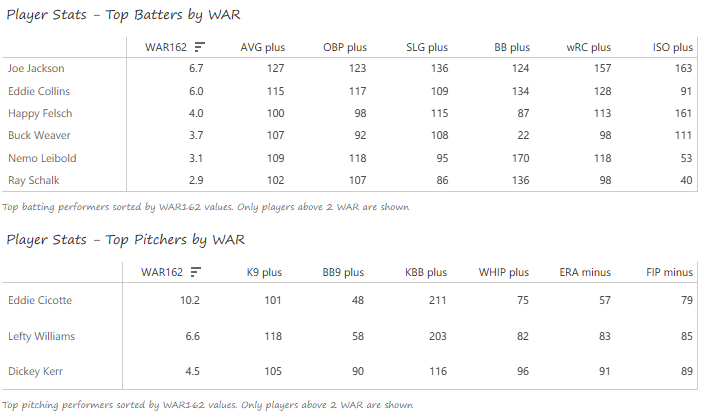
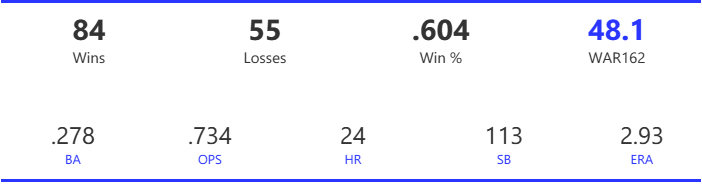
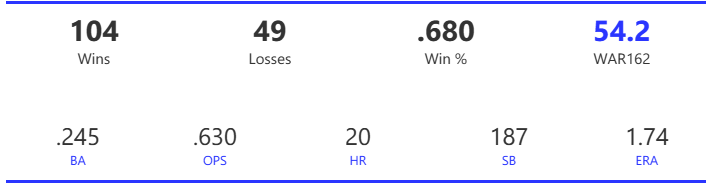
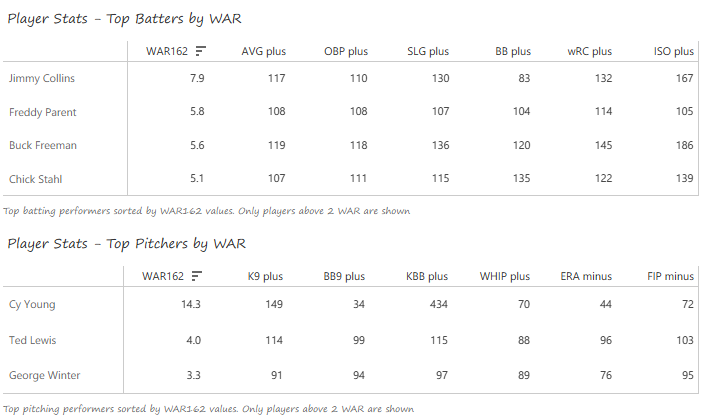
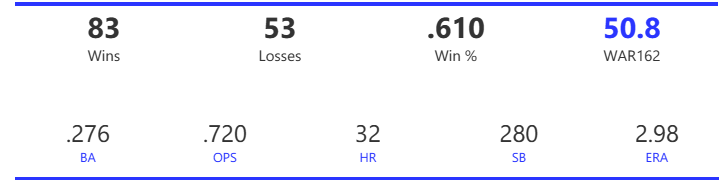
#7: 1915 Boston Red Sox, 52.4 WAR
The 1915 Red Sox edge out the same Tigers team they beat in a tight 1915 pennant race, with their better pitching offsetting the Tigers’ prolific offense. Like the Tigers, the Red Sox exceeded their Pythagorean win projection (by 6 games); this was a 95-win team based on their metrics.
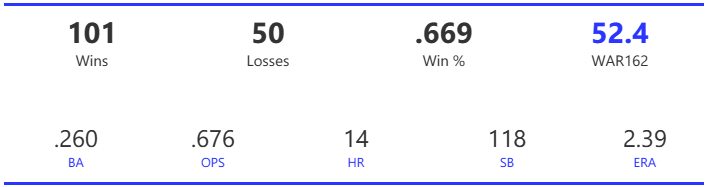
The Red Sox rank as an above-average offense for the 1915 season, certainly not at the Tigers’ level. They were 3rd in runs scored, 2nd in doubles, 2nd in BA, and 3rd in OBP and OPS. They also finished last in stolen bases, a far cry from the Cobb-led Tigers. On the mound, things were a bit stronger – 2nd in ERA, 2nd in WHIP, and 2nd in hits per 9 innings.
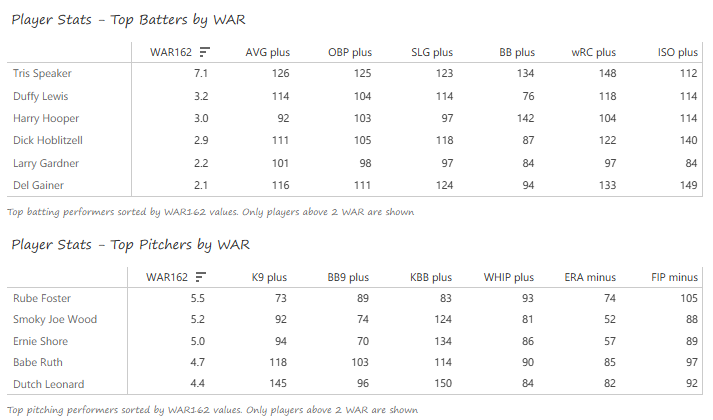
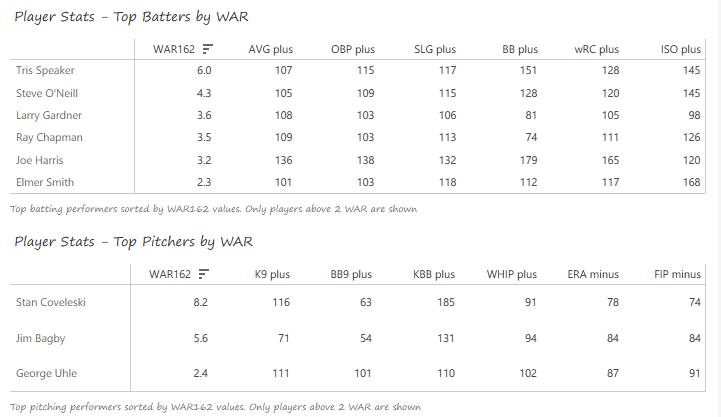
Center fielder Tris Speaker rates as the lone offensive standout for the 1915 version of the Sox, in addition to his superb defense. Speaker batted .322 with 108 runs scored, while his outfield partner, Duffy Lewis batted .291 with 76 RBI. Harry Hooper drew 89 walks, and Dick Hoblitzell batted .283. Five Red Sox pitchers topped the 4.0 WAR162 level, led by Rube Foster (19-8, 2.11 ERA). Smoky Joe Wood led the AL with a 1.49 ERA, Ernie Shore posted a 19-8 mark with a 1.64 ERA, and the 20-year-old Babe Ruth added 18 wins. Dutch Leonard led the AL with 6.4 hits per 9 innings on his way to a 15-7 record.
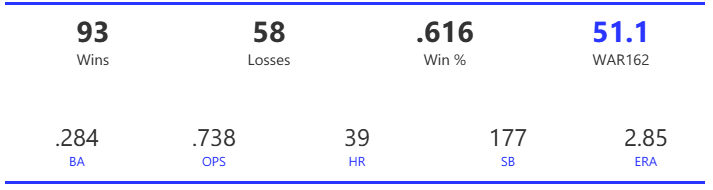
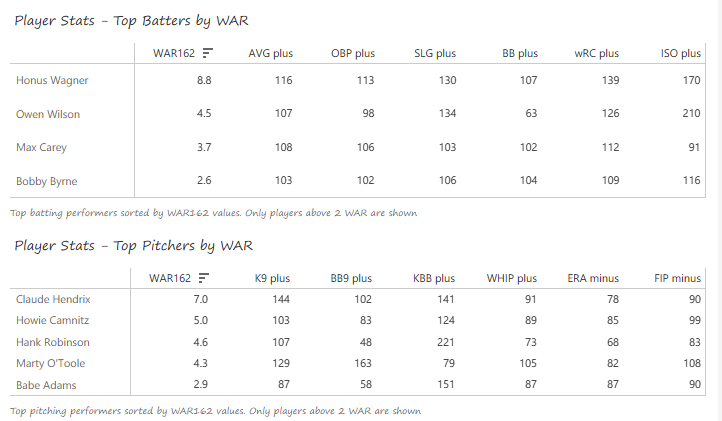
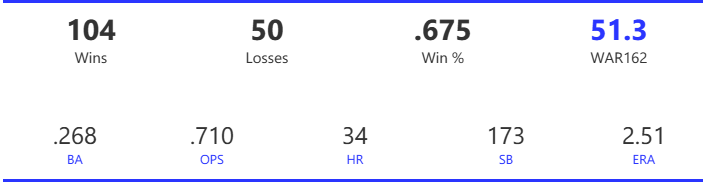
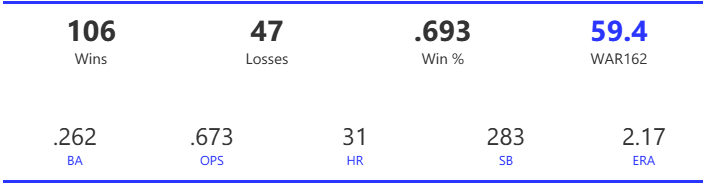
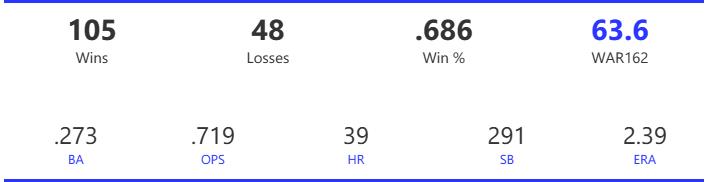
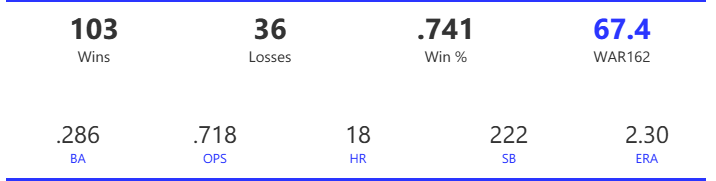
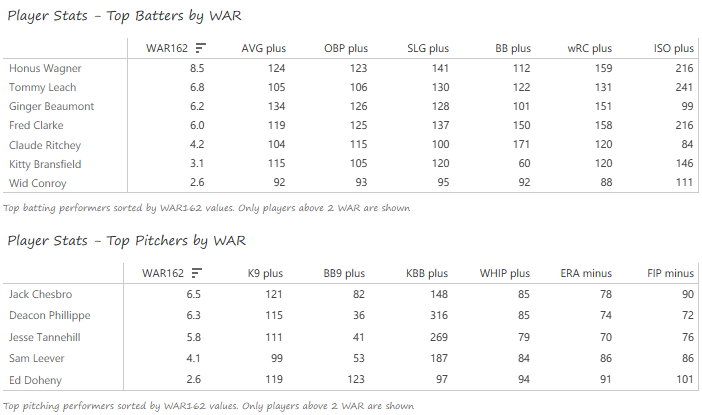
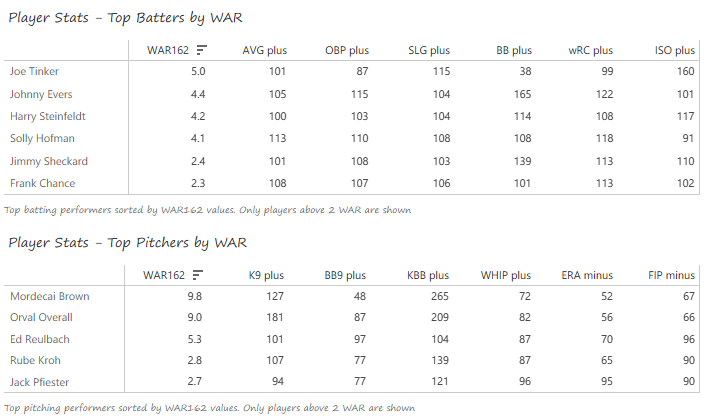
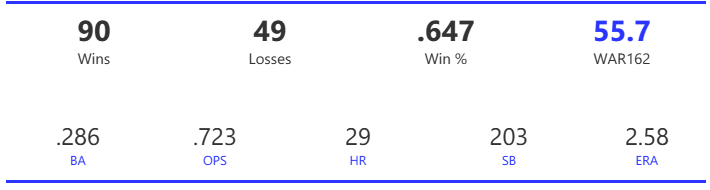
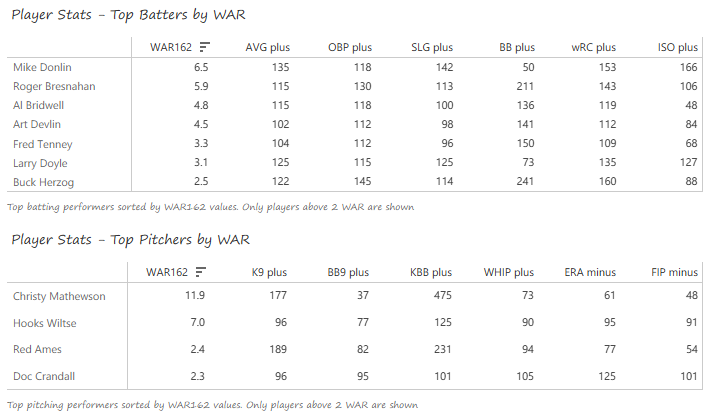
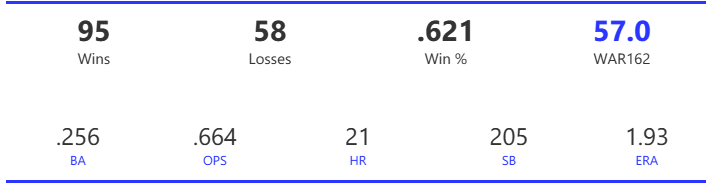
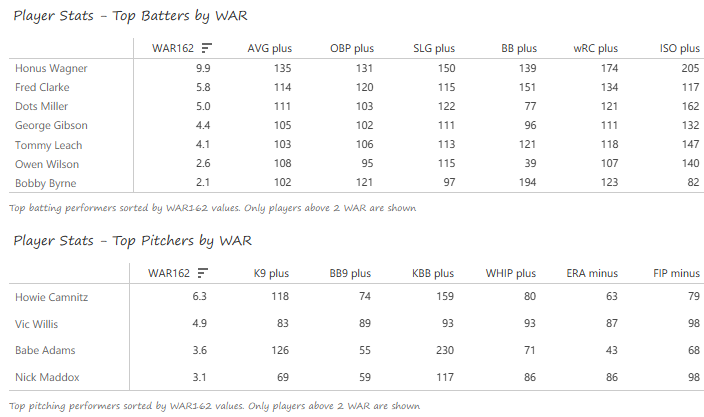
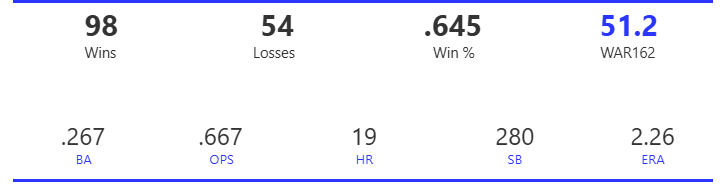
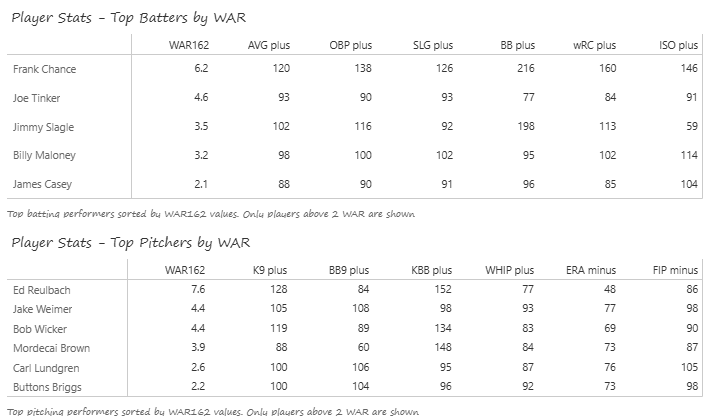
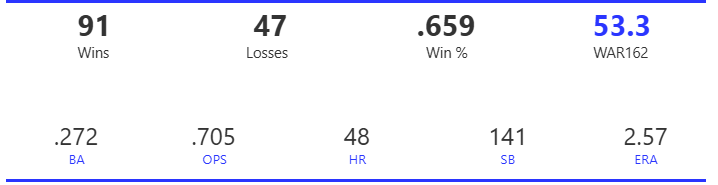
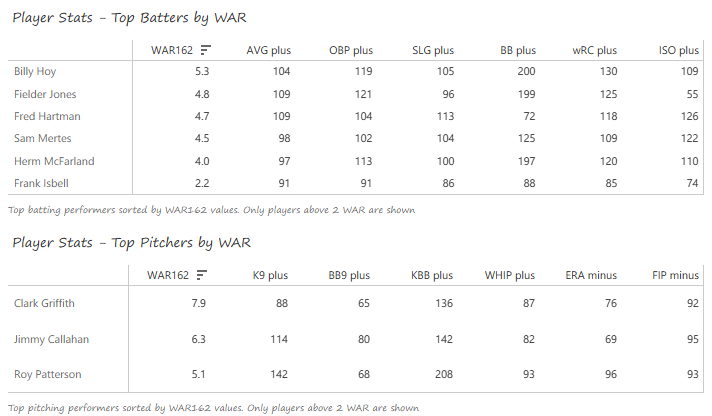
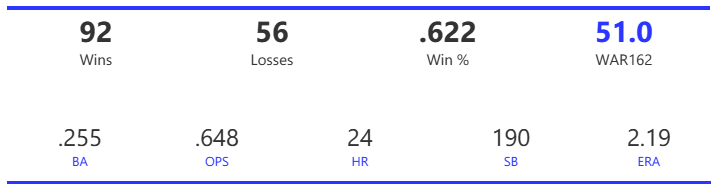
#6: 1912 New York Giants, 54.4 WAR
The 1912 Giants powered their way to 103 wins on the back of a prolific offense combined with very good pitching. The New Yorkers were in a dominant stretch that saw them win three consecutive pennants between 1911 and 1913.
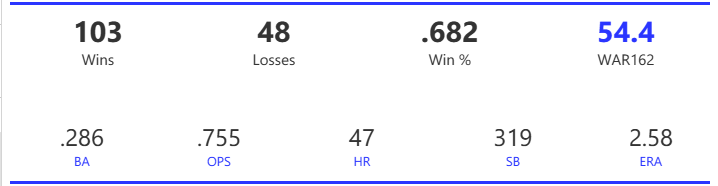
The Giants boasted the NL’s top offense, scoring 5.3 runs per game, well ahead of the Cubs and Pirates. Their 319 steals were far ahead of all rivals, and they also paced the NL in BA, OBP, and OPS. On the mound, the Giants were also dominant, leading the NL in ERA, WHIP, and strikeout-to-walk rate, issuing the fewest bases on balls in the NL.
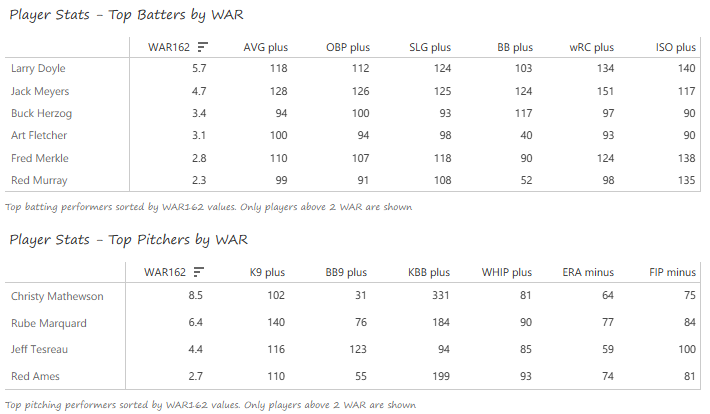
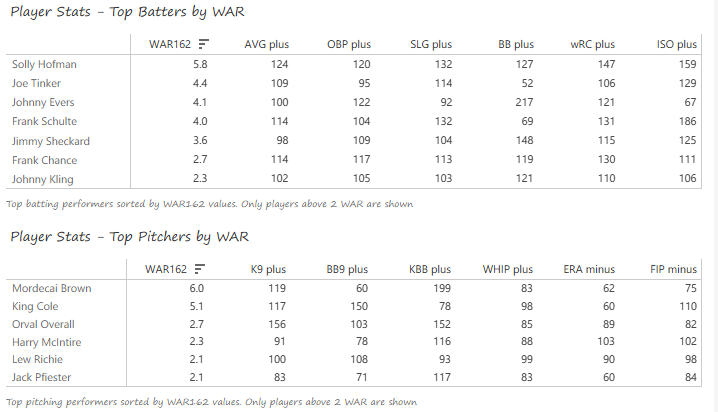
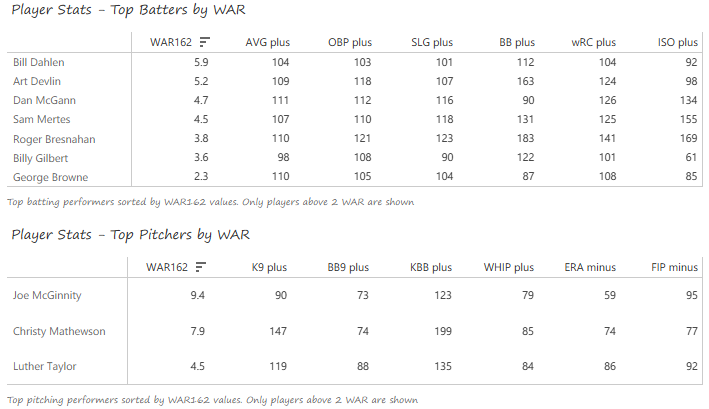
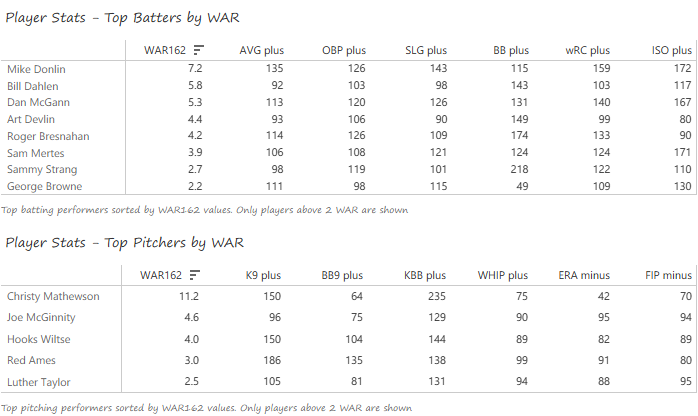
Once again, the Giants’ offense lacked star power, but thrived on the depth of their lineup. Larry Doyle produced with a .330 BA and 91 RBI, followed by catcher Jack Meyers, who led the NL with a .441 OBP built off a .358 BA. Buck Herzog stole 37 bases while playing a strong third base, and Art Fletcher hit .282 from his shortstop position. Christy Mathewson was again the top pitcher, with a 2.12 ERA and a league-best 1.0 walks per 9 innings. Rube Marquard went 26-11 in support of Mathewson, and Jeff Tesreau led the NL with a 1.96 ERA while posting a 17-7 record.
Summary
That’s it for this entry in our MLB Team Rankings for the 1910s decade! Stay tuned for the countdown from #5 to #1, arriving in a few days. As always, thanks for reading!