First 10 WAR Trade Networks Published!

The first 10 WAR (Wins Above Replacement) Trade Networks are now available for exploring! This initial group includes nine team networks and one overall graph with all teams included. Here’s a list of the 10 graphs:

Each of these and any upcoming WAR trade networks can be found on this page.

Let’s walk through how the graphs work, using the Detroit Tigers network as an example. We’ll begin with an anatomy of the graph display:

As the image shows, the primary focus will be the main graph area in the center of the window. This is where all nodes (transactions, teams, and players) will reside, connected by edges based on common relationships. Transaction nodes will vary in size based on the total value of a trade with the largest nodes indicating a trade that created significant future WAR for one or both teams. Team and player nodes are set to constant sizes so that the initial visual focus will be on the transaction nodes. The size differences become more noticeable when we zoom in to the network. More on that shortly.

Edges are also sized based on WAR value; this is where we see the value provided to a team and by specific players. Edge sizes (weights) will be more easily seen when we zoom in to the network.

On the left are some graph controls to assist in navigating the graph. We can zoom in using the slider control or the plus/minus buttons adjacent to the slider. Zooming can also be done with a mouse scroll if you prefer that option. The fisheye lens can be toggled on or off and can be used to highlight certain areas of the graph by hovering over a selected region. Finally, the edges button will enable showing or hiding edges and connected nodes. This is useful when you wish to reduce surrounding nodes and focus on specific transactions. We can also pan the graph by dragging it using a mouse – this is helpful in centering a network or viewing specific regions of the graph.

At the upper left of the window is a color legend for each node type, and hidden on the left (not shown in our image) is an information pane that will show specifics about the network. More on that in a bit.

Now let’s examine the information window – this is what makes the network truly powerful. When the network is first displayed or the browser window is refreshed the information pane displays information about the graph (open it by clicking on the arrows icon at the top left):

You can see the simple overview of the graph, the source data, and what it aims to accomplish. Here’s an enlarged version for easier reading:

If we zoom in and select a specific transaction the pane displays the relevant details for that selection:

Now we have the details for the transaction – the season, teams, and players involved. Here’s the enlarged view:

You can do this for any transaction in a graph, or you could choose to select a team or player to see how they fit into the network. The possibilities are nearly endless and it’s a fun way to understand the relationships between teams, players, and trades.

We’ll do more exploring of the networks in upcoming posts; I’ll also be adding more teams until we have a complete set of trade networks. In the meantime, feel free to explore the graphs to learn more about the best (and worst) trades your favorite team has made over the last 120 years. Enjoy, and thanks for reading!

FacebooktwitterlinkedinrssFacebooktwitterlinkedinrssby feather
FacebooktwitterredditpinterestlinkedinmailFacebooktwitterredditpinterestlinkedinmailby feather

Player Ego Network Visualization

Ego networks are an interesting concept within the realm of network visualization using graph analysis, as they allow us to easily see direct connections within the network of a particular individual. Using Gephi, we can navigate large networks using this technique, which enables us to filter and view only those connections relevant to our current criteria. All remaining nodes and edges are simply filtered out from a visual perspective, giving a very clean look at individual networks. The ego network can be set to a depth of 1 if the goal is to show only direct connections, or to 2 or even 3 if our goal is to see the so-called “friends of friends” via indirect connections.

My latest venture uses a network of all MLB players between 1901 and 2015, which consists of a somewhat unwieldy mass of nearly 17,000 players with close to 1.2 million connections. Even when we cluster the results using Gephi’s modularity class option, it is still a difficult network to navigate, both from a visual perspective and a resource allocation viewpoint. Here’s a view of the network as a whole:

mlb_players_20161230

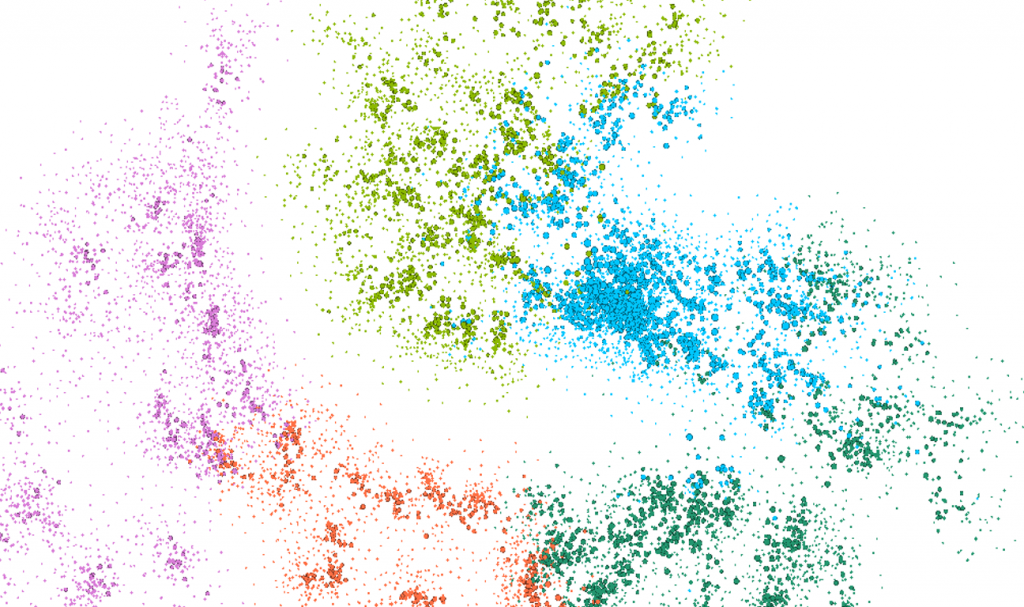
While the modularity class coloring helps identify groups of related players, there is an awful lot of small detail that is not easily discerned, and the graph is computationally expensive, often crashing my version of Gephi if I try to do too many things with the full graph. Fortunately, ego networks are a great way to filter the data for greater understanding of some of the details within the network.

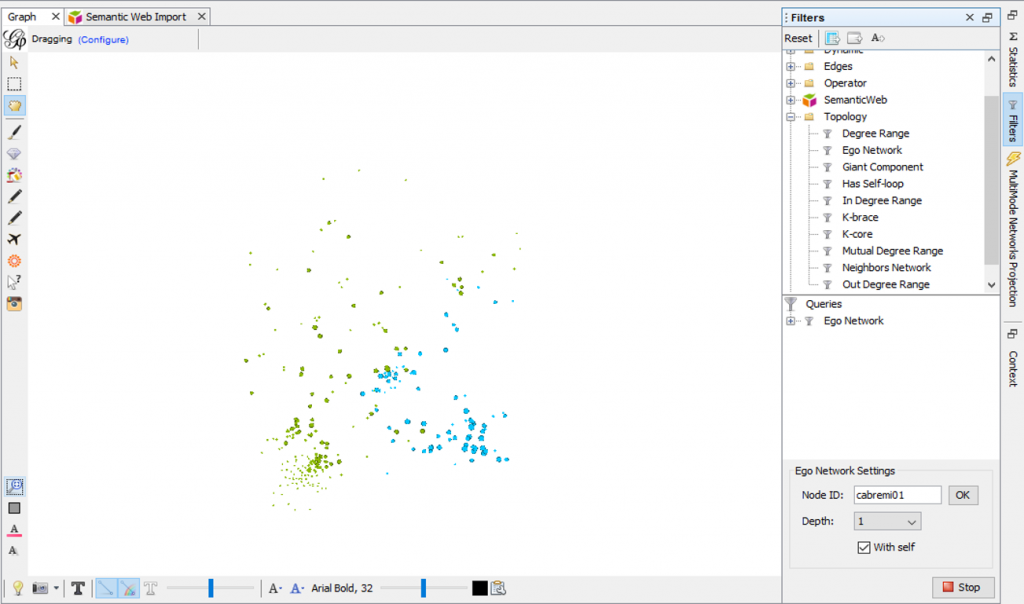
Using the ego network option as a filter, I am able to view the individual network of any player in the graph with ease. Here’s a look at my settings for the Miguel Cabrera ego network, and the resulting network, which is now a very manageable 300 nodes and 11k edges:

mlb_ego_filter_20161230

With a little editing in Gephi, such as increasing the size and adjusting the color for the central node, I can easily create a series of ego networks that can later be exported to a JSON format for use with Sigma.js. These can then be turned into interactive web-based networks quite easily. Here, we change the existing node settings so that the Cabrera node stands out in the graph. First, we locate Cabrera’s record in the data worksheet, and then select the node edit menu option:

mlb_edit_node1_20161230

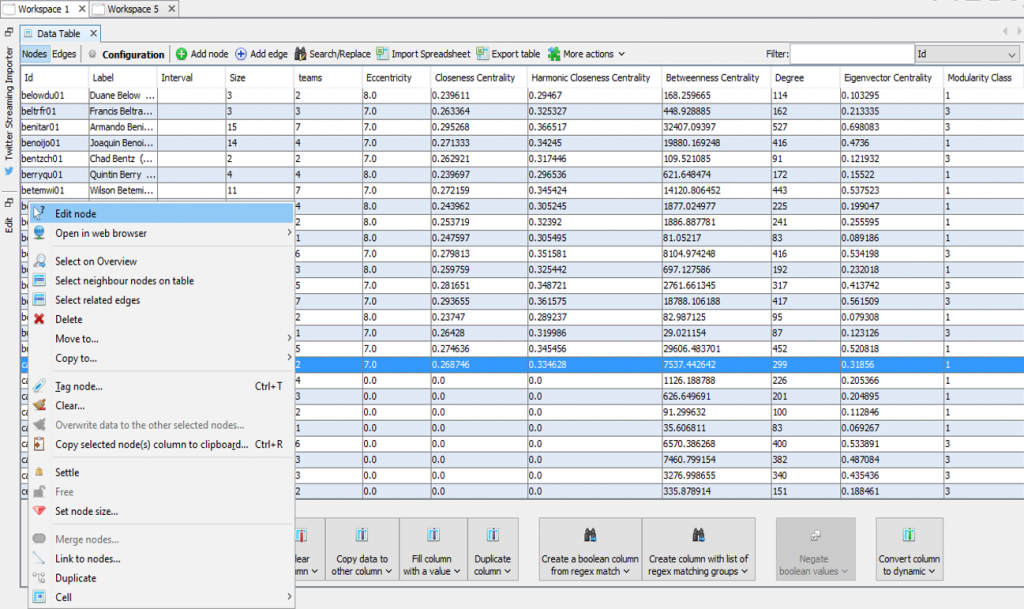
This then takes us to the node properties, where size and color can be edited:

mlb_edit_node2_20161230

If this step causes some overlap in the graph, we can easily run the Noverlap layout algorithm to optimize graph spacing. Here’s a view of the completed Cabrera network after using Sigma.js and tweaking a few of the config settings:

Cabrera_20161130

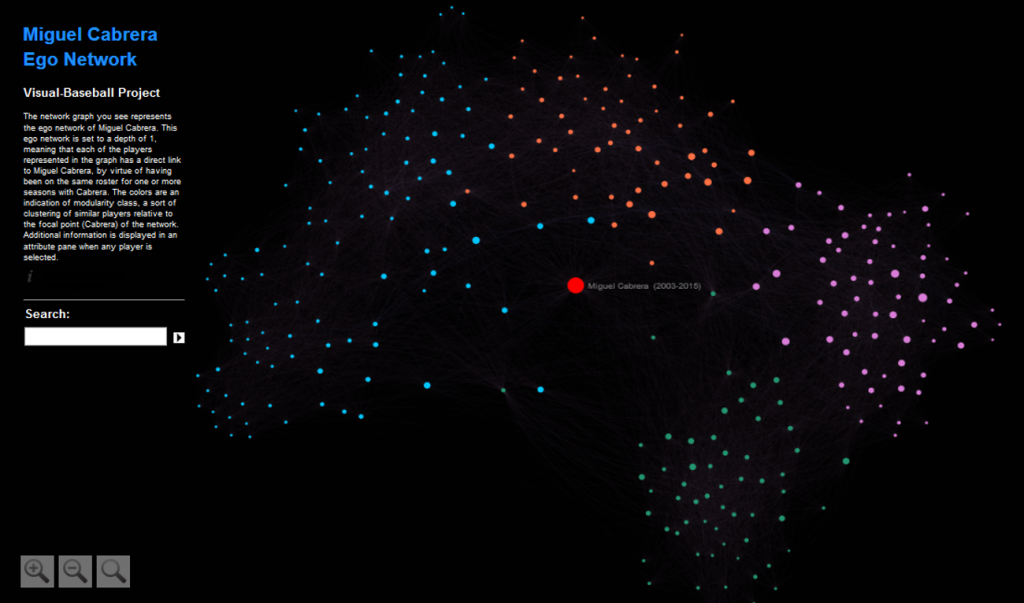
As of now, there are five of these ego networks available for viewing on the visual-baseball site. They can be found here. I promise more to come in 2017 as time permits. Update – 25 networks as of 1/15/2017.

FacebooktwitterlinkedinrssFacebooktwitterlinkedinrssby feather
FacebooktwitterredditpinterestlinkedinmailFacebooktwitterredditpinterestlinkedinmailby feather