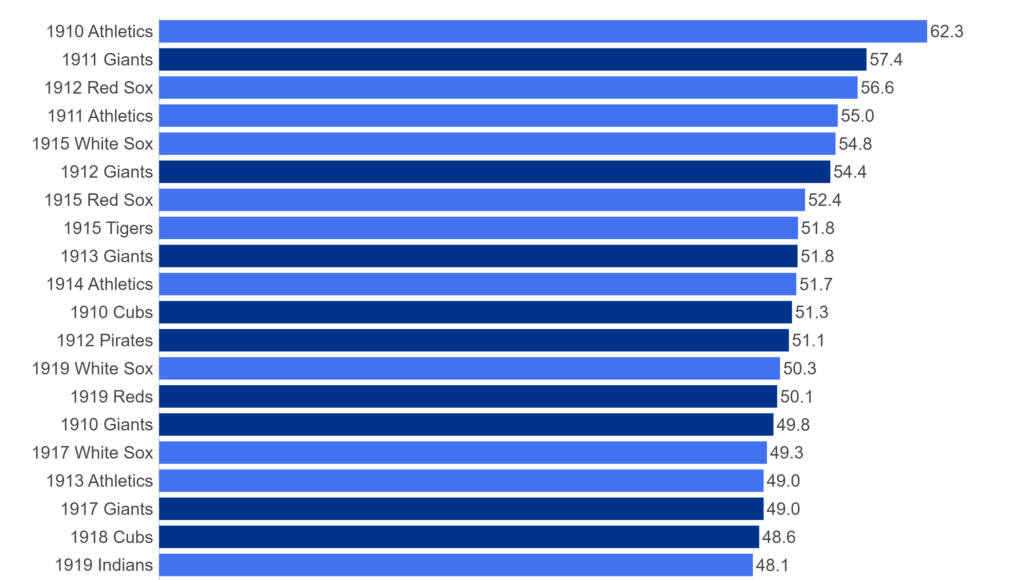
Welcome to the next countdown post in our series of 1910s MLB Team Rankings. As a reminder, the teams are ranked from #20 through #1 based on aggregate WAR162. For the 1910s (1910-1919), a total of 160 teams were eligible (16 teams x 10 seasons), so the top 20 teams are a fairly exclusive group. We’ll summarize each team, including portions of their team dashboard, and explain how they attained their ranking. So, without further ado, here are the teams ranked #15 through #11.
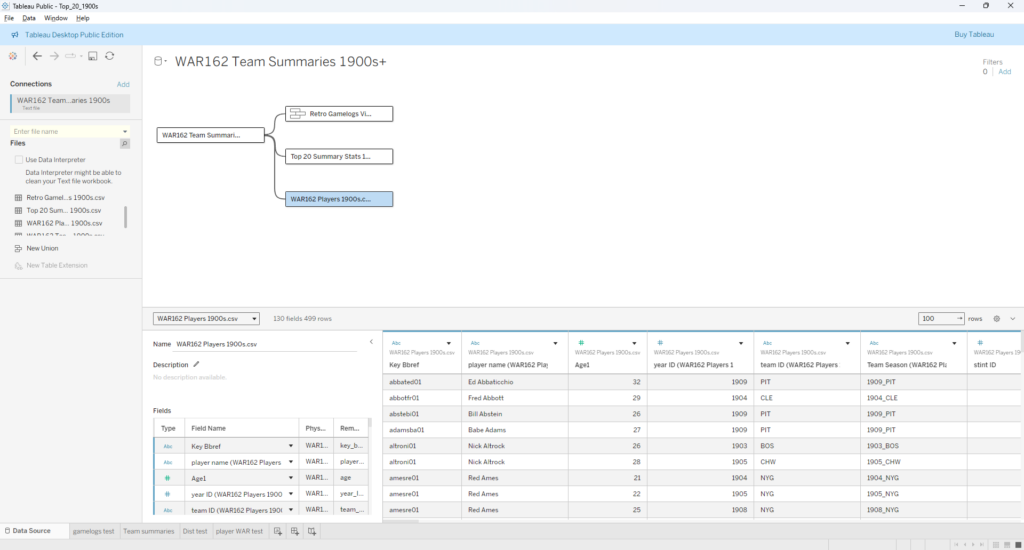
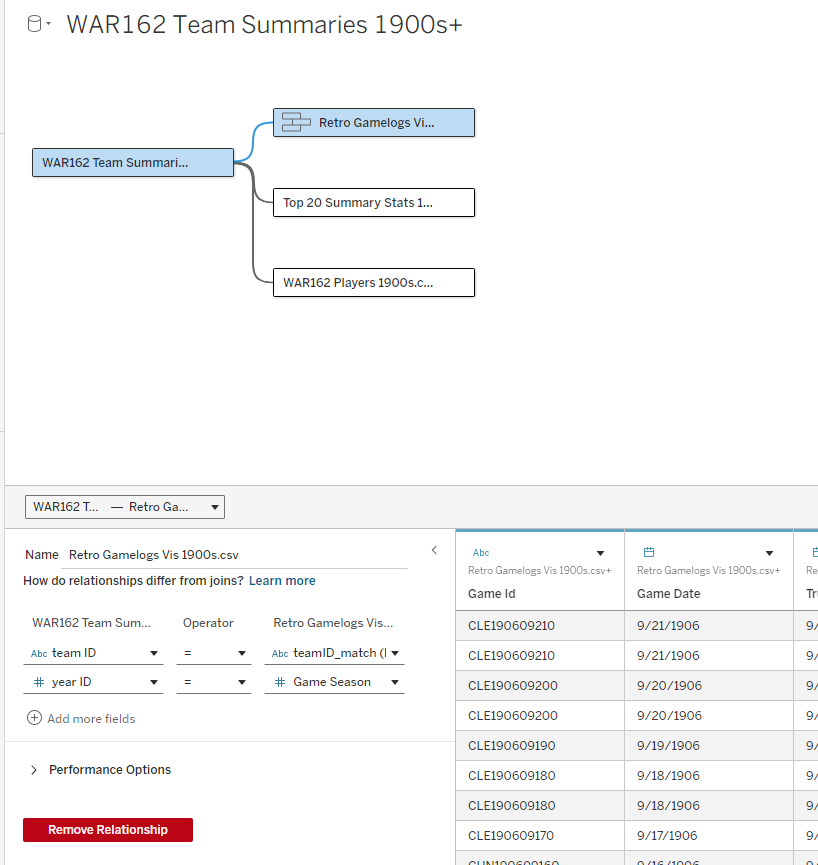
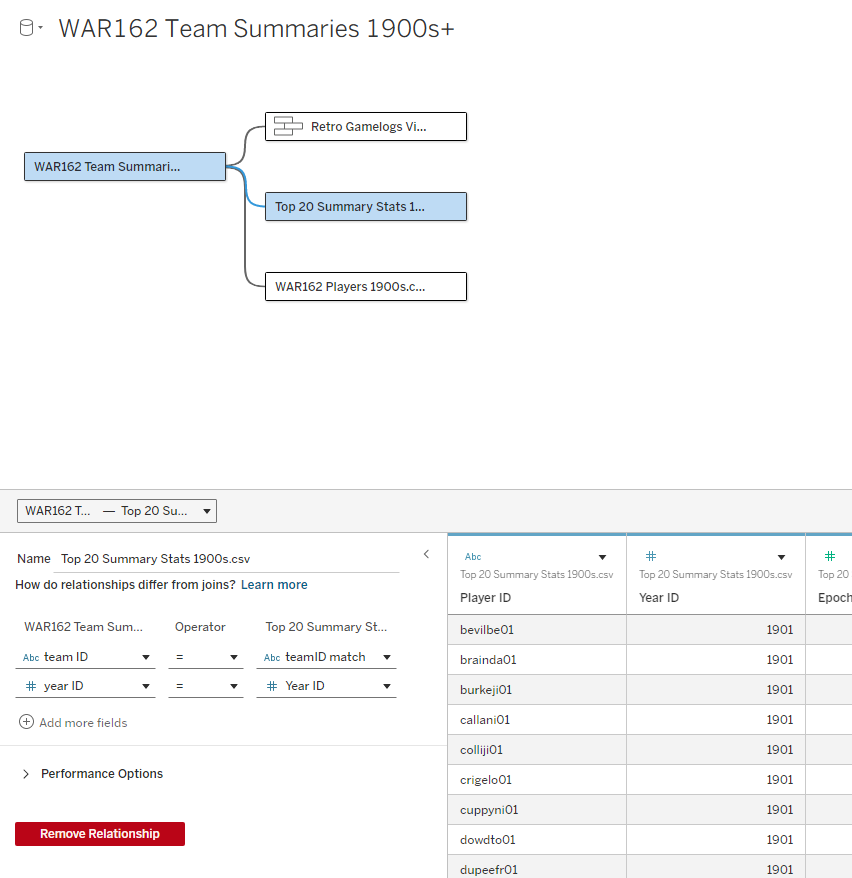
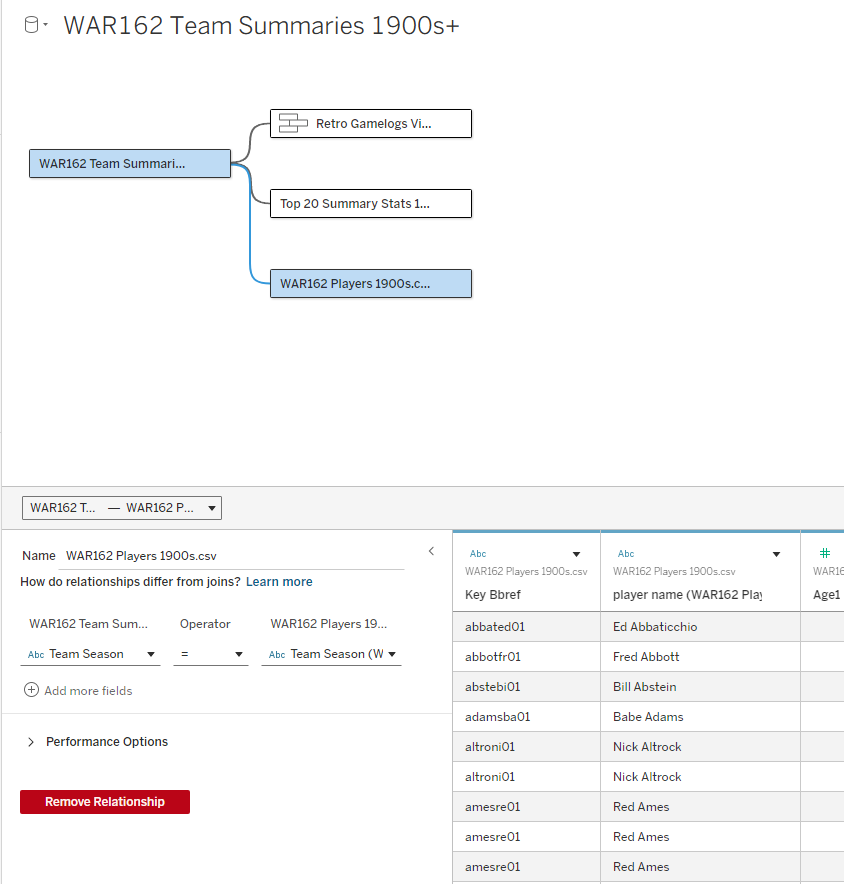
Here’s the interactive dashboard at Tableau Public: 1910s Top 20 MLB Teams Dashboard
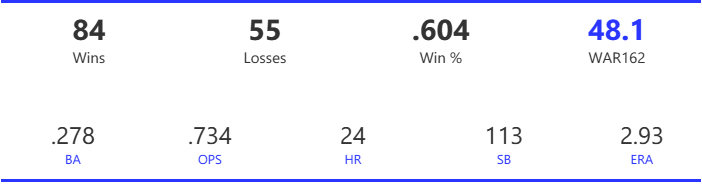
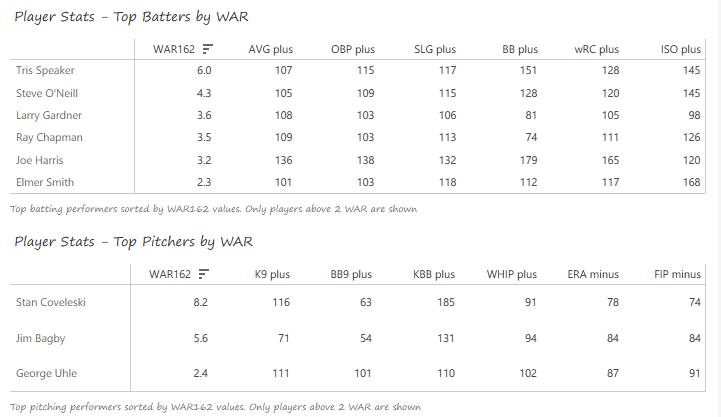
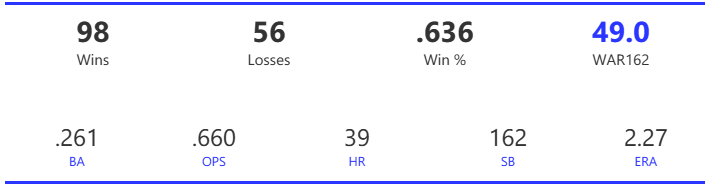
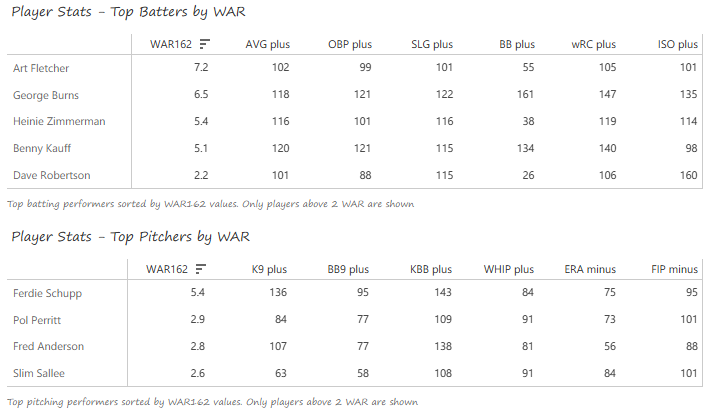
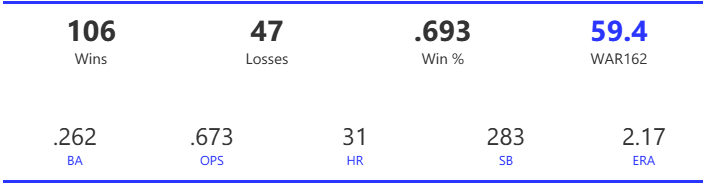
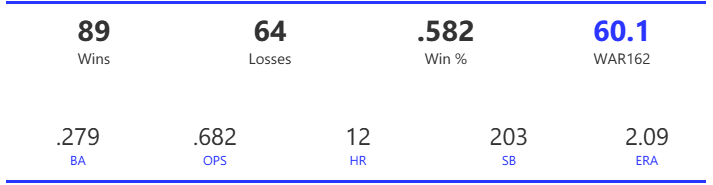
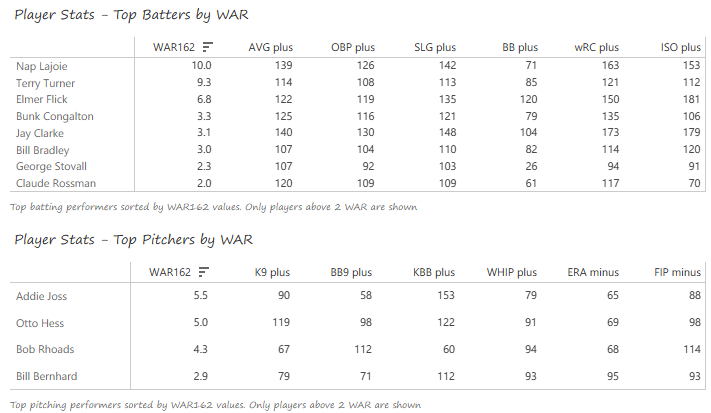
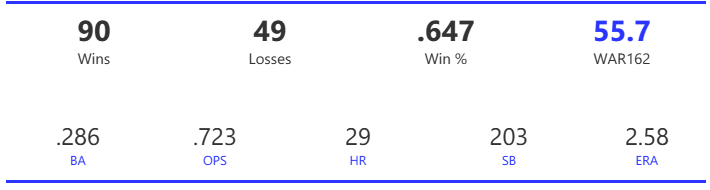
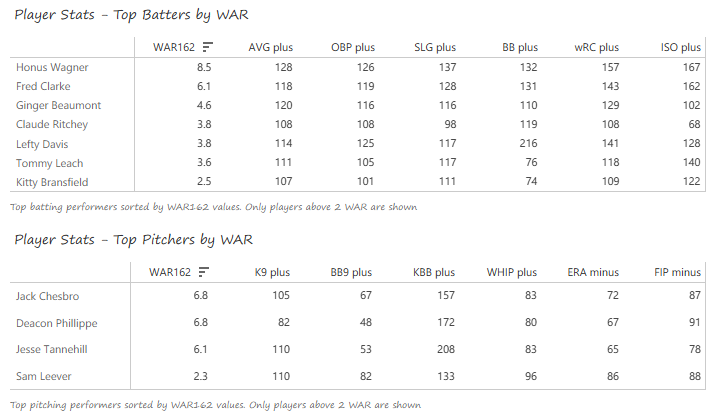
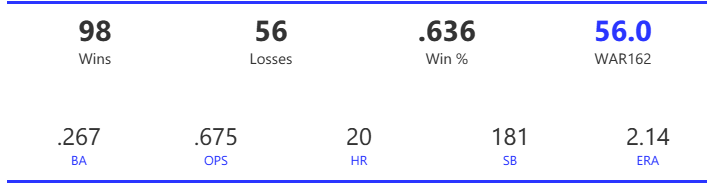
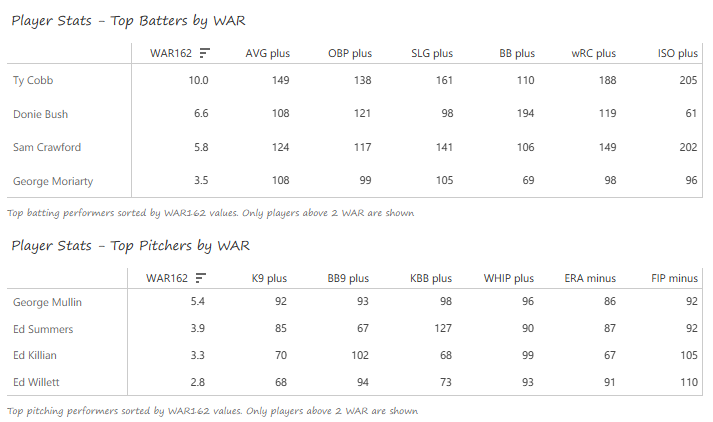
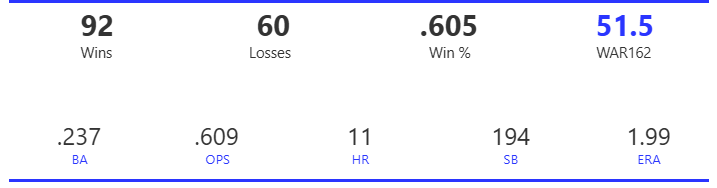
#15: 1910 New York Giants, 49.8 WAR162
The 1910 Giants won 91 games but finished 13 games behind a powerhouse Cubs team. They had a strong offense and good pitching, but not enough of both to derail the Cubs. However, this was just the beginning for a franchise that would become dominant in the coming years.
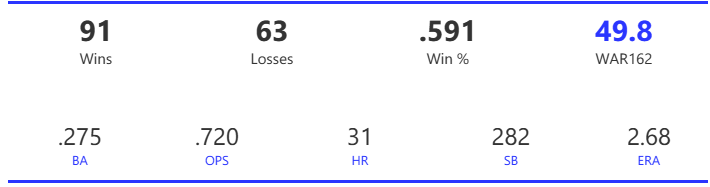
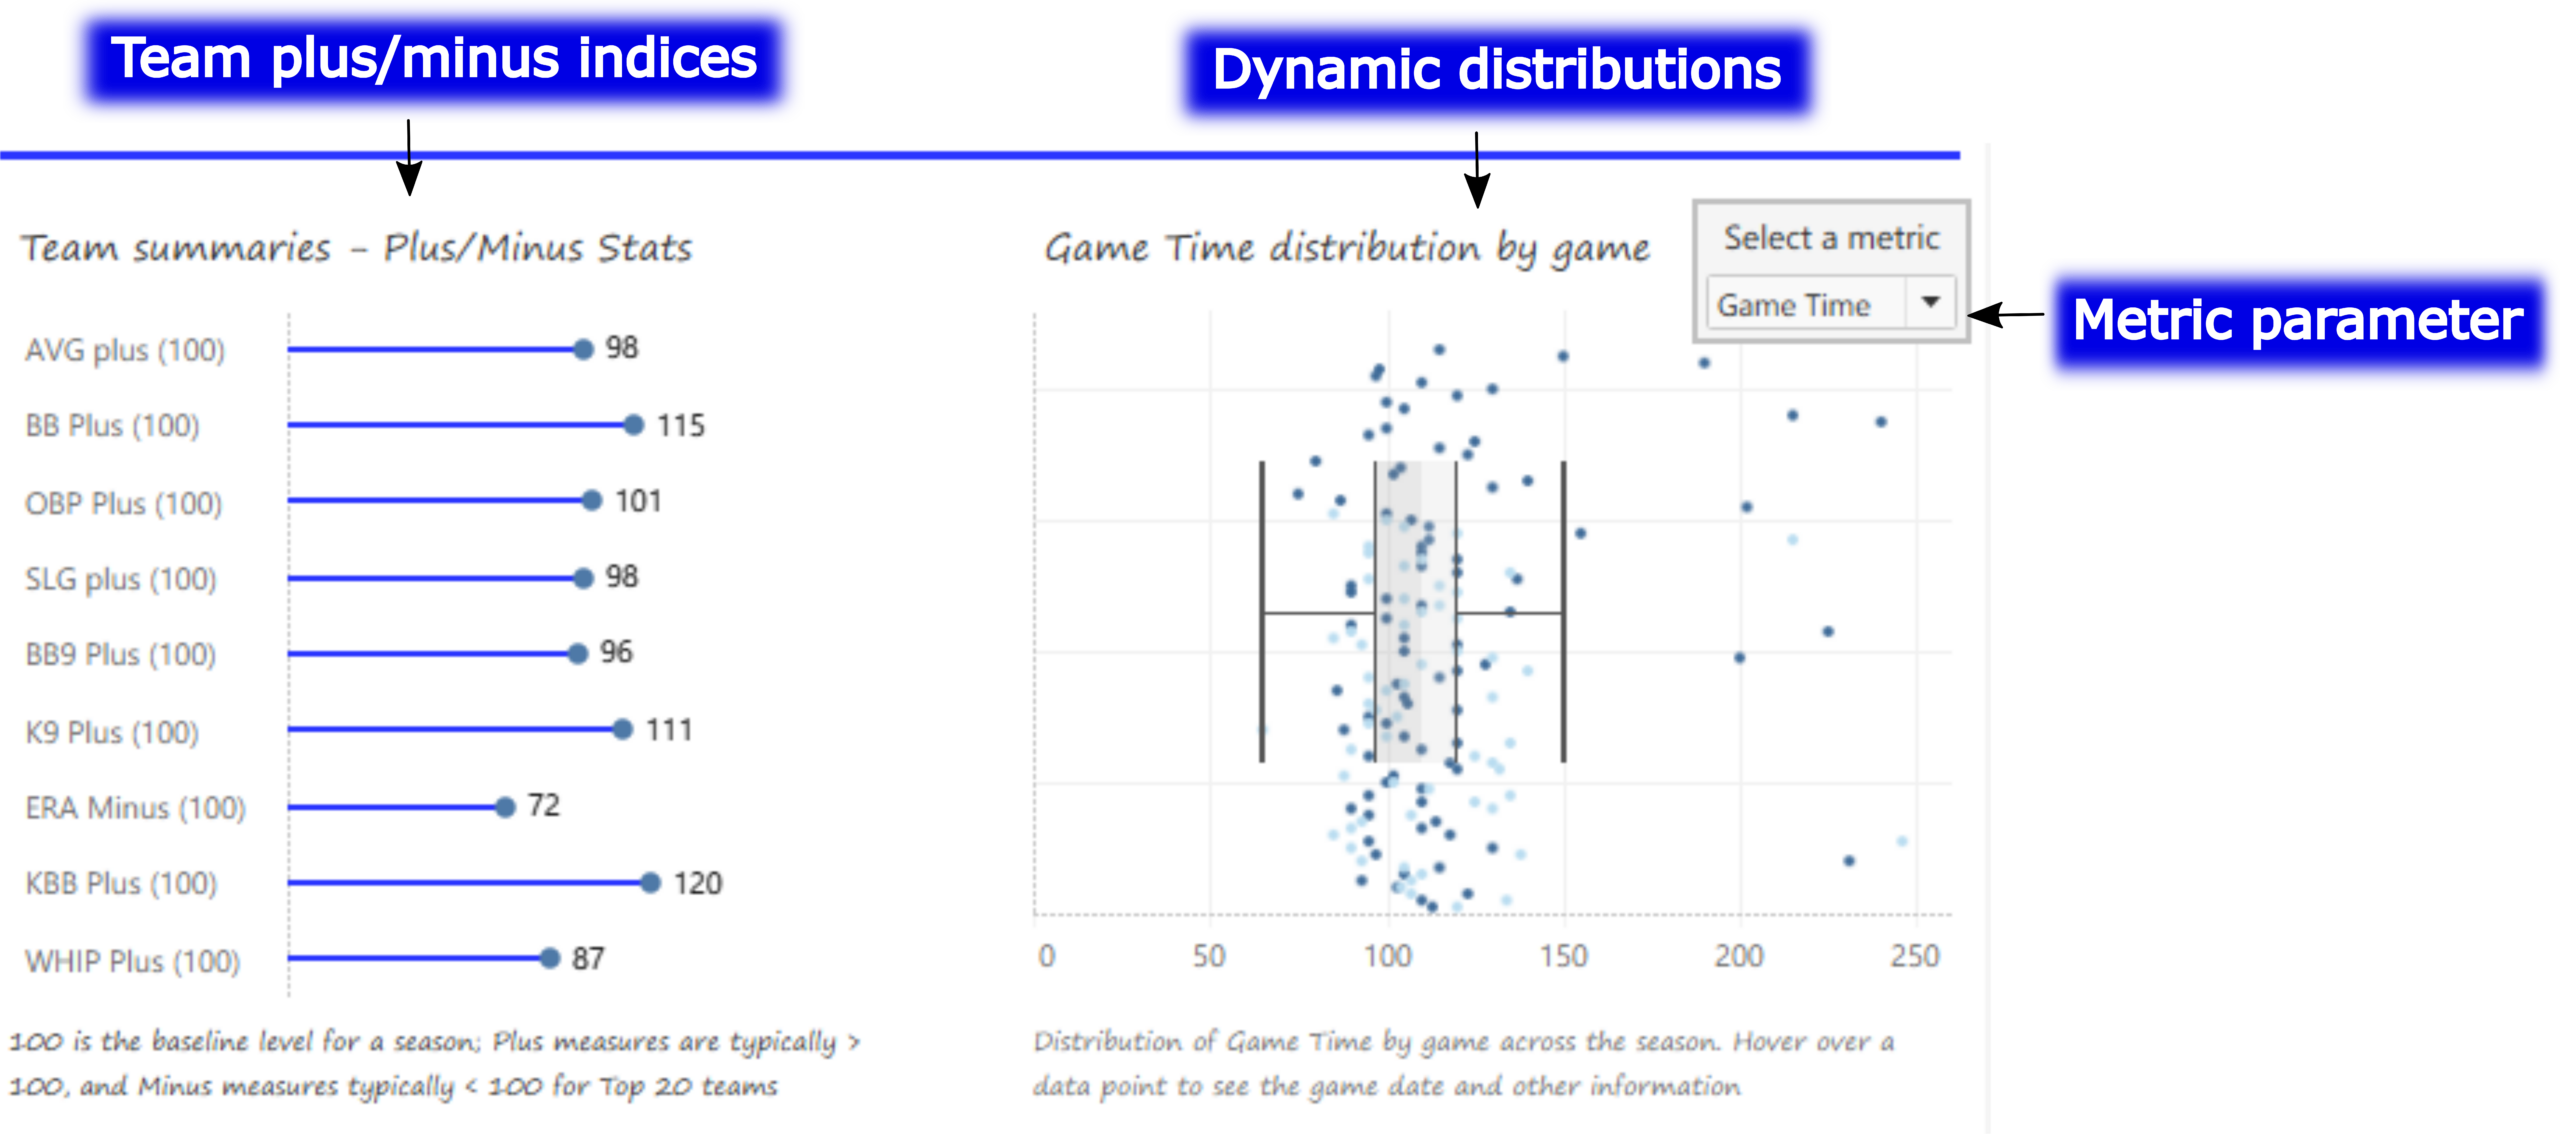
The Giants led the NL in multiple offensive measures – runs, BA, OBP, and OPS, and ranked second in stolen bases. The pitching was also solid – second in ERA, third in WHIP, and first in strikeouts. Defense was a bit of an issue, as their 291 errors ranked near the bottom of the league, whereas the Cubs committed the fewest of any NL team.
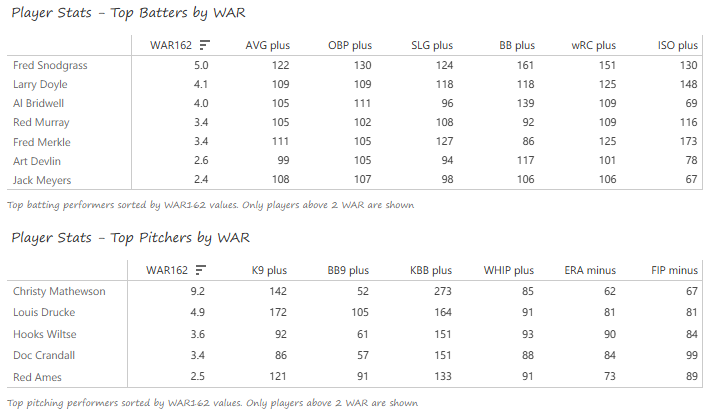
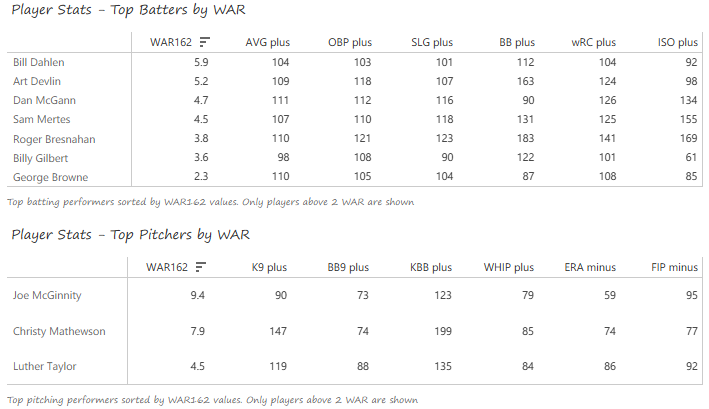
Fred Snodgrass compiled the highest WAR among position players despite missing 31 games, batting .321 with an exceptional .440 OBP and 33 steals; Larry Doyle stole 39 bases and batted .285, while Al Bridwell posted a .374 OBP. Christy Mathewson was the ace on the mound, topping the NL in wins (27), complete games (27), and strikeout-to-walk rate (3.07). From there, it was a fairly steep drop to Louis Drucke (12-10, 2.47 ERA) and Hooks Wiltse (14-12, 2.72 ERA).
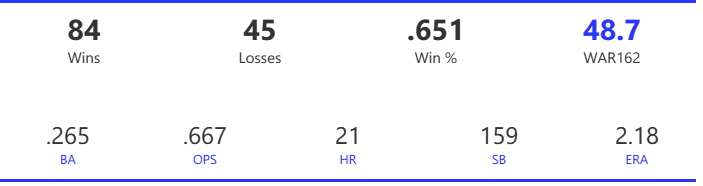
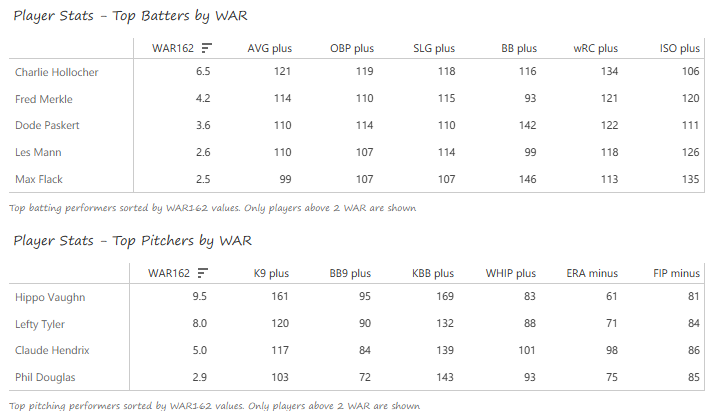
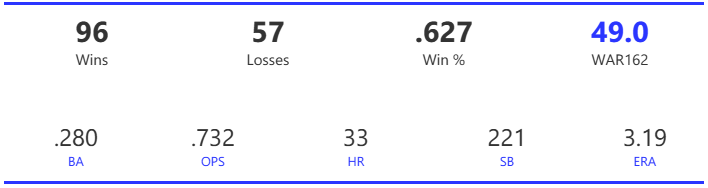
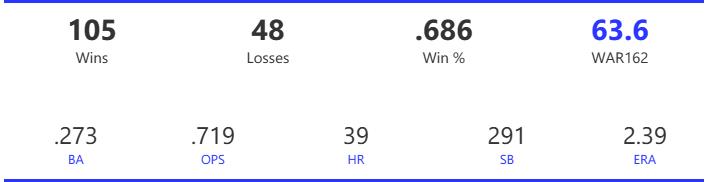
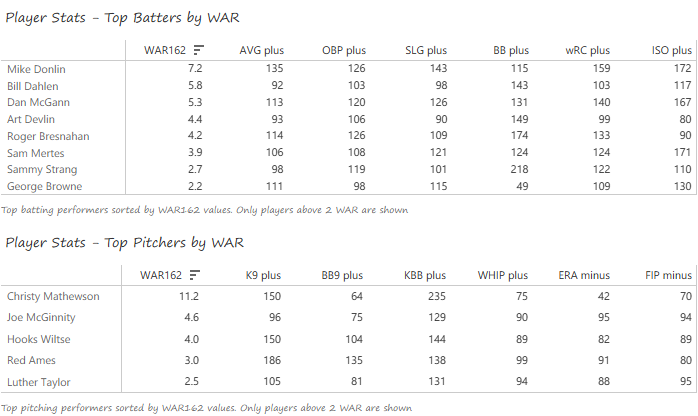
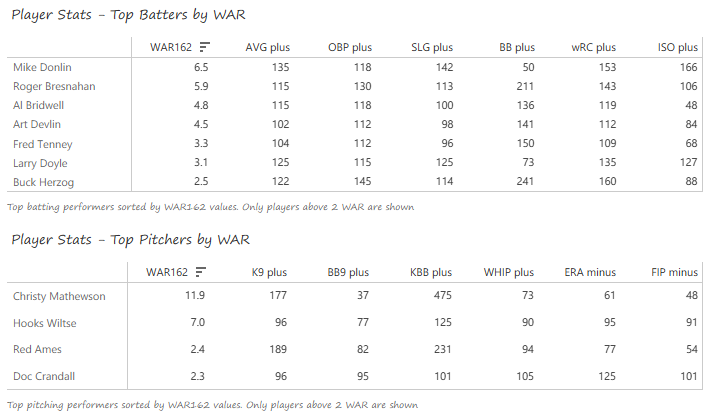
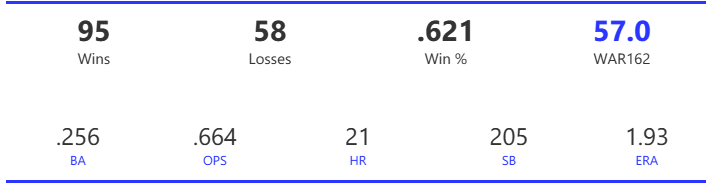
#14: 1919 Cincinnati Reds, 50.1 WAR162
The 1919 Reds are the first Cincinnati team to appear in the rankings, having won the NL pennant and the World Series (the infamous Black Sox scandal series). While history views the White Sox as the superior team, the Reds rank just one spot behind the Chicago squad in these rankings after cruising to the NL title by a comfortable 9-game margin.
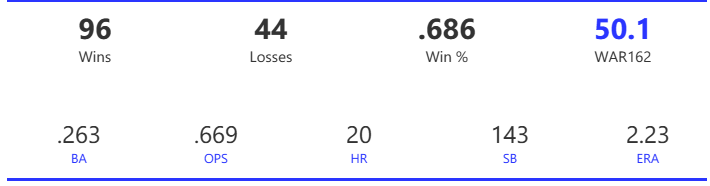
The Reds were a bit lucky with their 96 wins; the Pythagorean projection was for 92. Regardless, they were the best NL team with the best run differential. The team finished first in OBP and second in runs, BA, OPS, and stolen bases. On the pitching side, the Reds led the league in WHIP and complete games, and placed second in ERA. Offensively and on the mound, they were a balanced club without a lot of stars.
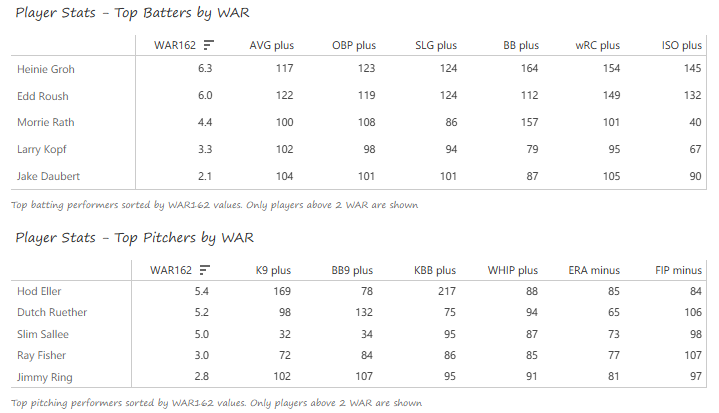
Heinie Groh and Edd Roush led the way offensively. Groh paced the NL with an .823 OPS, batting .310, while Roush led the league with a .321 BA. Morrie Rath covered a lot of ground defensively from his second base position while batting a solid .264. On the mound, the Reds boasted three starters with similar success rates. Hod Eller posted a 19-9 mark while Dutch Ruether went 19-6 with a 1.82 ERA. Slim Sallee chalked up the most wins on the staff with 21; it was a well-balanced staff with ample support beyond the top three.
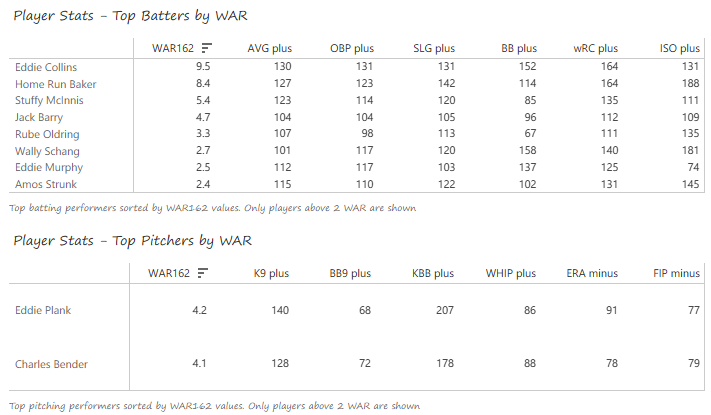
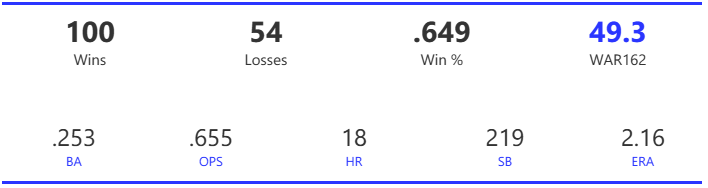
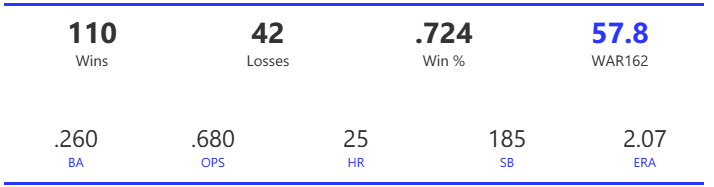
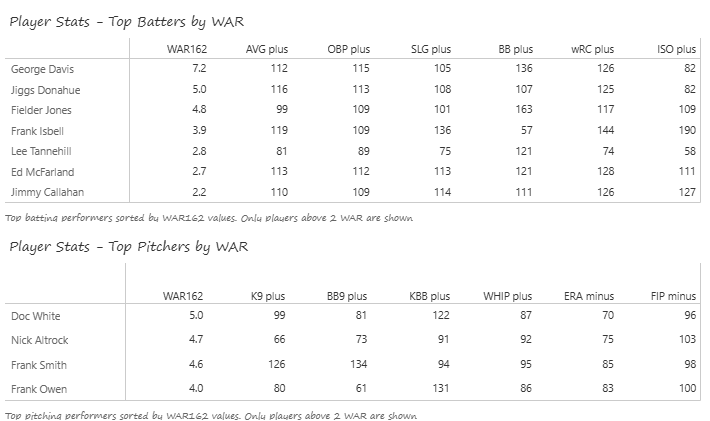
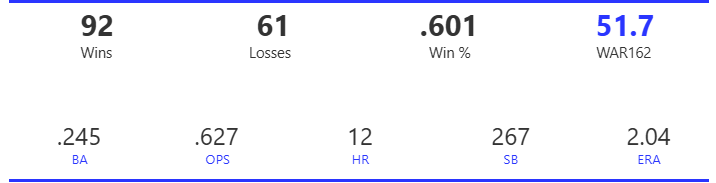
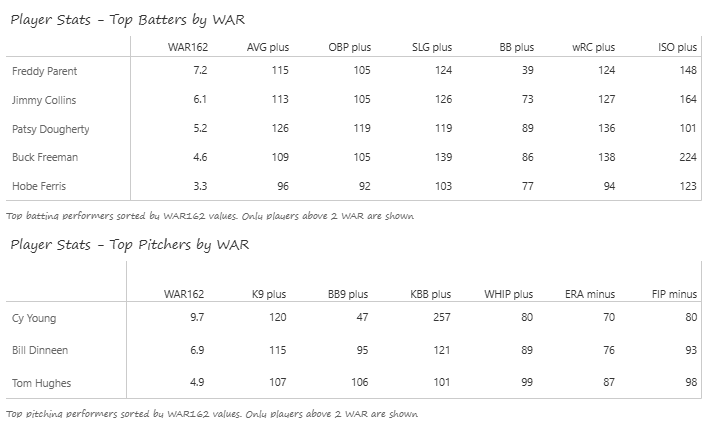
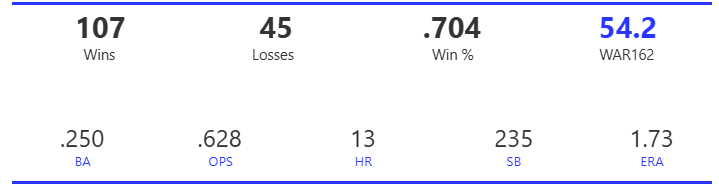
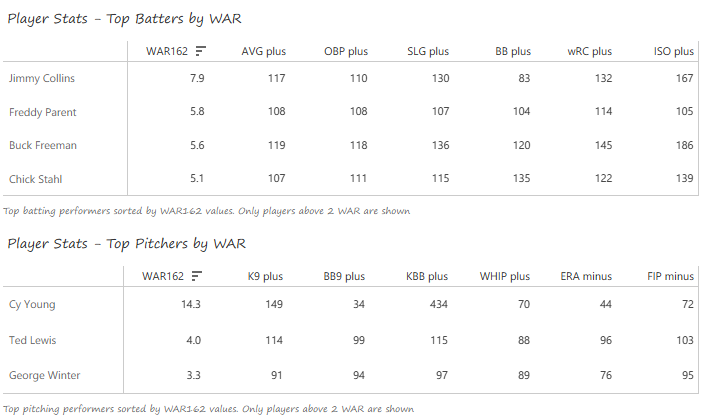
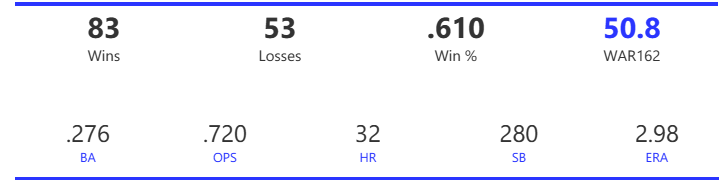
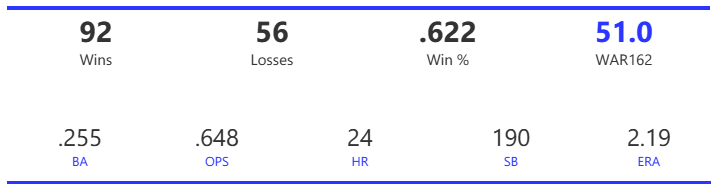
#13: 1919 Chicago White Sox, 50.3 WAR162
The 1919 White Sox won the AL pennant by 3.5 games over the Indians, buoyed by a 30-19 mark in one-run games. They were certainly a very good team, but hardly the powerhouse squad history makes them out to be. As we previously noted, the 1919 Reds team they faced in the World Series is regarded as virtually identical from a WAR162 perspective.
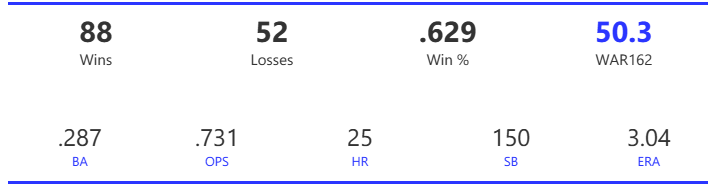
The White Sox led the AL in runs, BA, and stolen bases, while placing second in OBP and OPS. They did have the best run differential in the league, the result of a solid offense, above-average pitching, and good defense. While their team ERA ranked fifth, they were second in WHIP and had the best strikeout-to-walk rate in the NL.
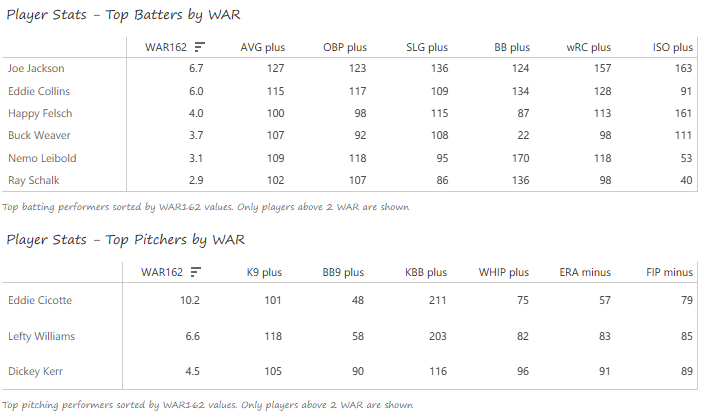
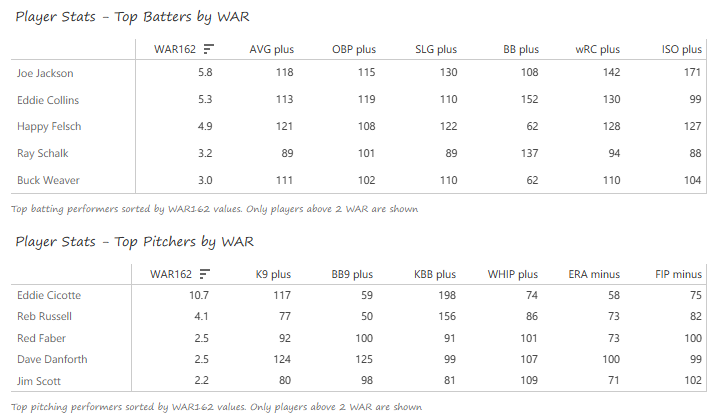
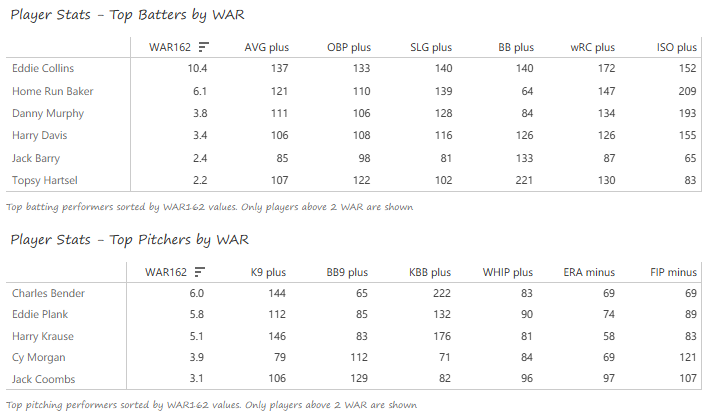
Joe Jackson (“Shoeless Joe”) and Eddie Collins were the standout position players, with Jackson batting .351 with 96 RBI and a .928 OPS. Collins stole 33 bases, best in the AL, and batted .319. Happy Felsch (34 doubles, .275 BA) and Buck Weaver (.296 BA, 89 runs) provided ample support. Eddie Cicotte had a sensational year, leading the league in wins (29), innings (306), complete games (30), and walks per 9 innings (1.4). Lefty Williams put together a 23-11 season, and Dickey Kerr went 13-7, primarily in relief.
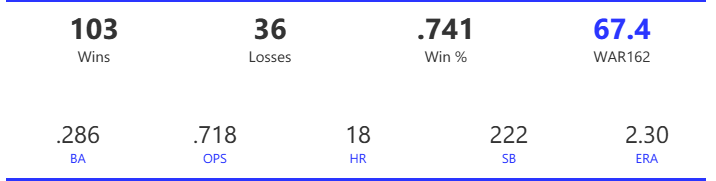
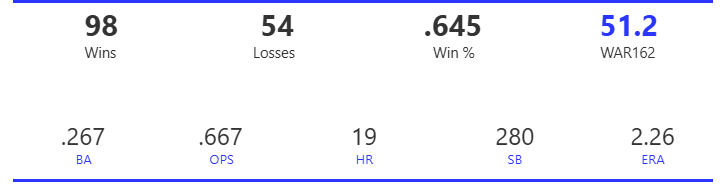
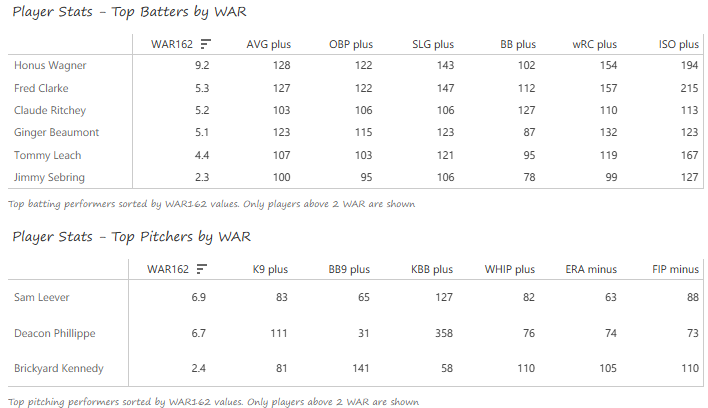
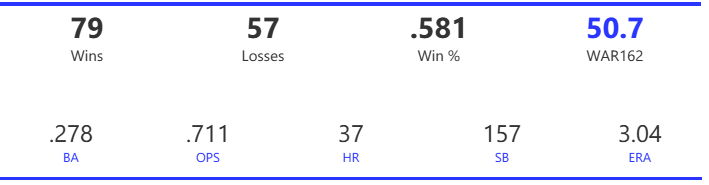
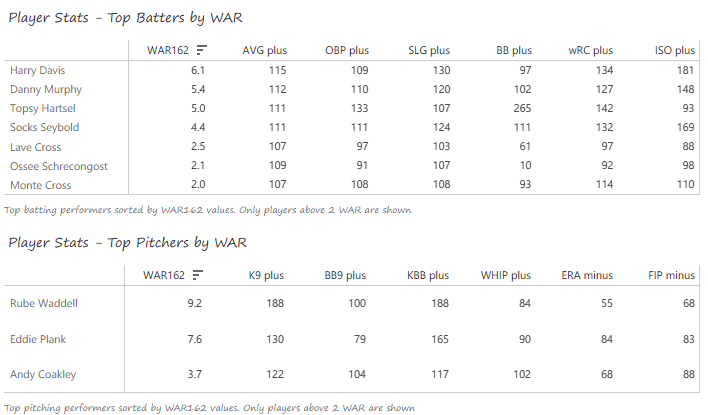
#12: 1912 Pittsburgh Pirates, 51.1 WAR
The 1912 Pirates were a fine team that had the misfortune to compete against a loaded Giants team, relegating them to a distant second-place finish, 10 games back.
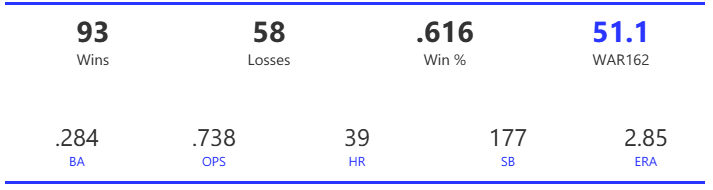
The Pirates’ .284 BA was second behind the Giants, and they ranked third in runs and OPS. They did hit the most triples in the NL, but were middle of the pack on many offensive measures. The pitching was a bright spot, where they tossed 18 shutouts (NL-best) and compiled a 2.85 ERA (2nd). The Pirates staff also struck out the most batters in the league. This combination of effective pitching and average to above-average offense was good enough to seal the team’s second-place finish.
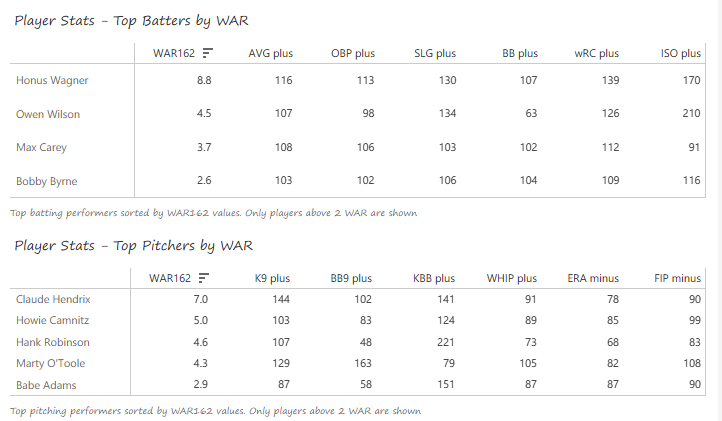
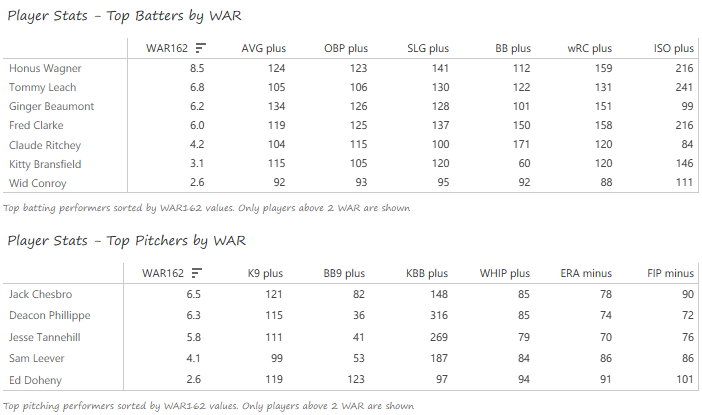
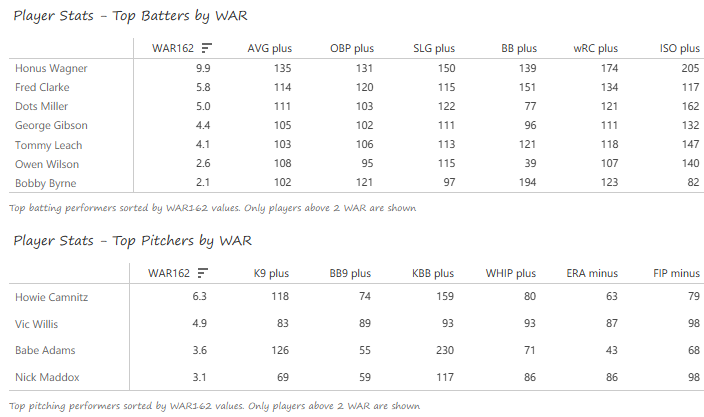
An aging Honus Wagner (38) was still the offensive catalyst for Pittsburgh. Wagner batted .324, had an .891 OPS, stole 26 bases, and accumulated 101 RBI. Owen Wilson logged an incredible NL-best 36 triples along with 11 homers and a .300 BA, and 22-year-old Max Carey stole 45 bases while batting .302. The pitching was balanced in the absence of any major stars. Claude Hendrix assembled a 24-9 record with a 2.59 ERA, while veteran Howie Camnitz posted a 22-12 slate. Hank Robinson was effective, often out of the bullpen, and Marty O’Toole won 15 games, leading the NL with 6 shutouts.
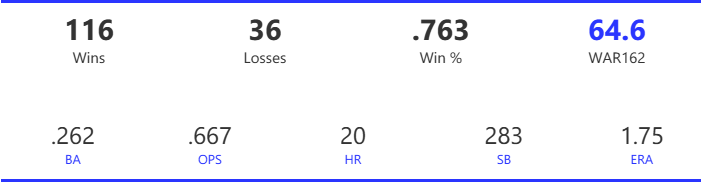
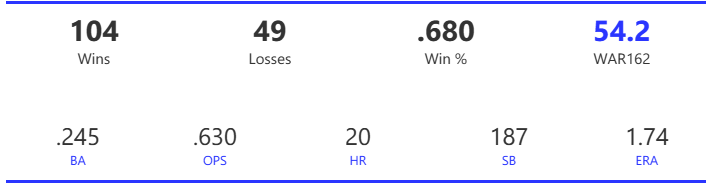
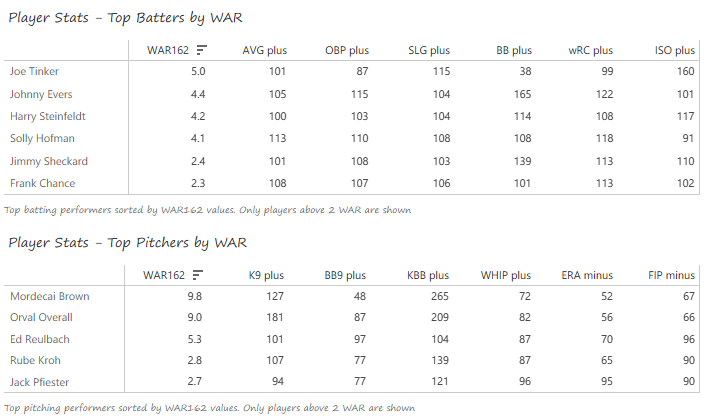
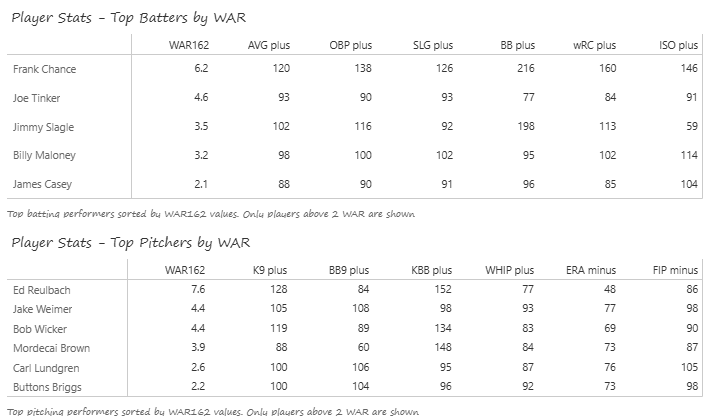
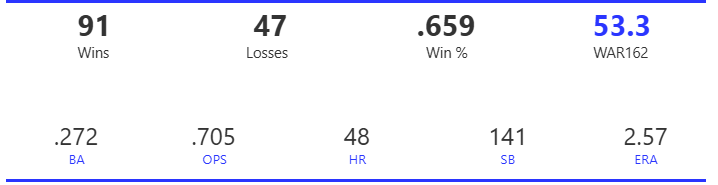
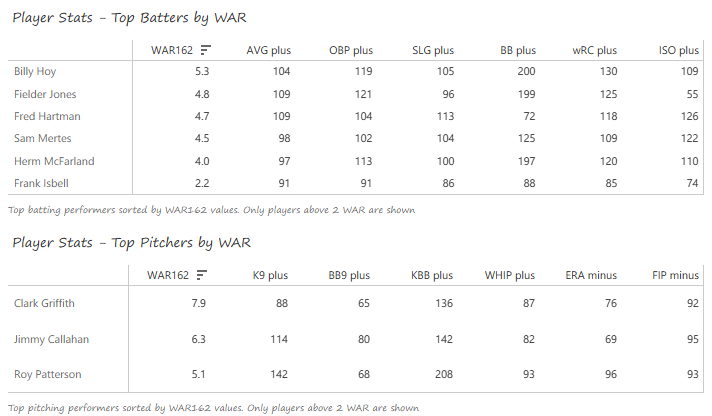
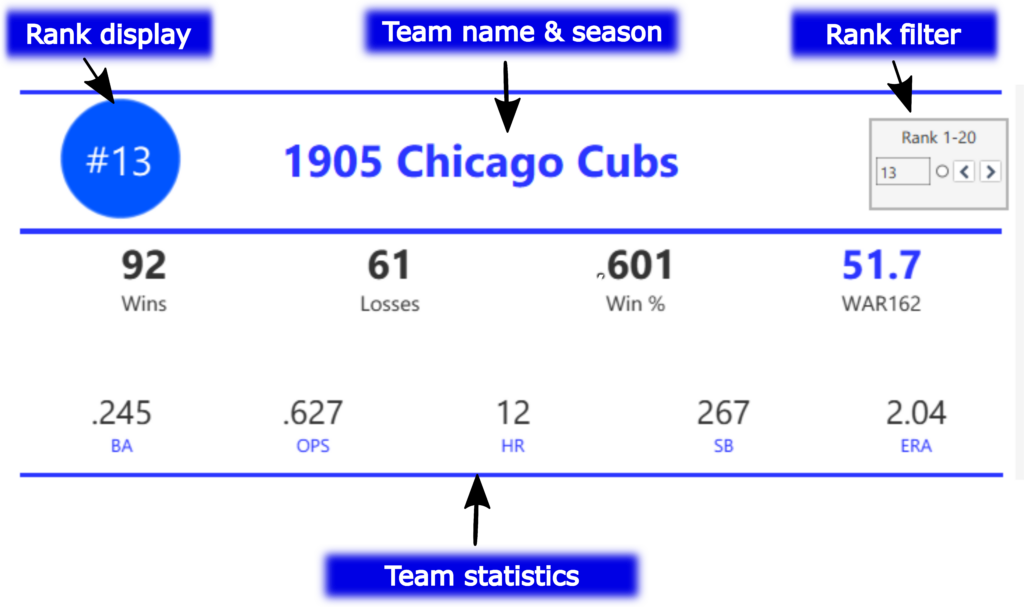
#11: 1910 Chicago Cubs, 51.3 WAR
The 1910 Cubs won the NL pennant by 13 games over the Giants; those roles would begin to reverse the following season. This club continued the Cubs’ stretch of excellence that saw four pennants in a five-season span, starting with the 1906 club.
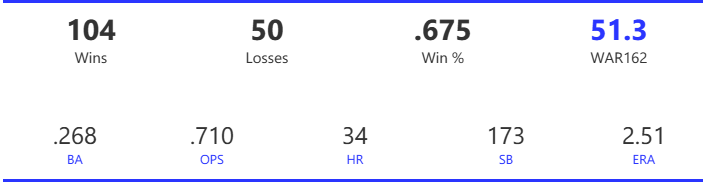
The Cubs’ possessed a solid offense – 2nd in runs, 2nd in doubles, 2nd in triples, 2nd in BA, and 2nd in OPS. In most of these categories, they were looking up at the Giants, who were ascending as the top NL offense for the next several years. As usual, pitching is where the team really excelled, starting with a league-best 2.51 ERA and 25 shutouts. The staff also recorded the best WHIP, narrowly edging the Pirates, and allowed the fewest hits per 9 innings.
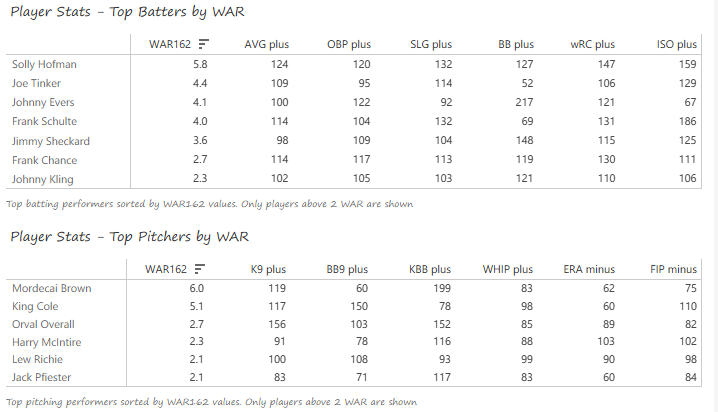
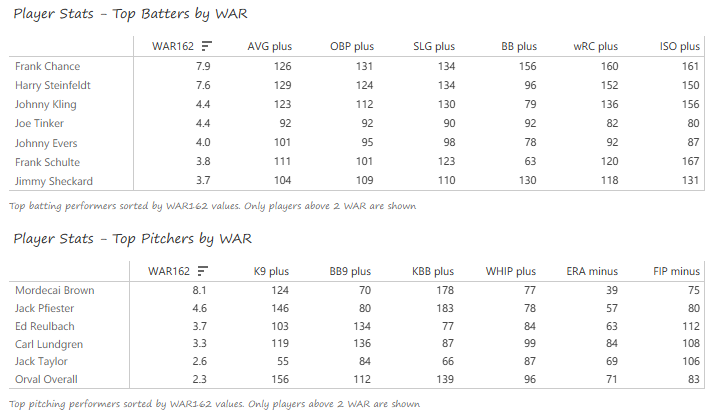
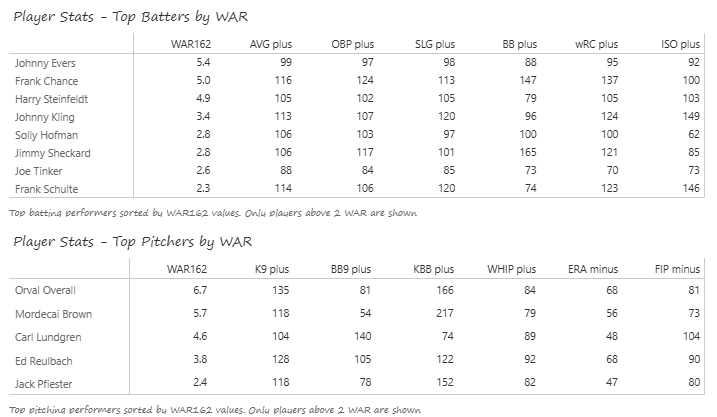
The Cubs rarely had a dominant hitter like some of their competitors in this period, but they had multiple contributors who often provided 3-6 WAR162 each season. For 1910, those players were outfielder Solly Hofman, who batted .325 with an .867 OPS, Joe Tinker, with a .288 BA and solid defense at shortstop, and 2nd baseman Johnny Evers, with 108 walks leading to a .413 OPS. Mordecai Brown again led the Cubs pitchers, posting a 25-14 record with a 1.86 ERA, and earning the unusual honor of leading the NL in both complete games and saves, as well as shutouts. King Cole led the NL with a 1.80 ERA to support his 20-4 record, and Orval Overall (12) and Harry McIntire (13) combined for 25 wins.
Summary
That’s it for this entry in our MLB Team Rankings for the 1910s decade! Stay tuned for the countdown from #10 to #6, arriving in a few days. As always, thanks for reading!